


Well, the economists kept their streak going; they have now under-forecasted claims for 18 of the past 21 weeks (including revisions). That is impressive. For comparison, the odds against flipping 18 or more "heads" on a coin in 21 flips are approximately 1341-1 against. So economists can take solace in that their recent consensus forecasts have been statistically different from a coin flip. Worse, as it turns out, but at least different.
That being said, I wouldn't have had the timing right either if I was forecasting the weekly number. On the other hand, I probably wouldn't have been consistently low, either.
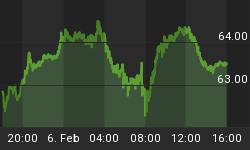
The count of initial unemployment claims looks as if it has started to climb again (see Chart). As an aside, the current level of 500k exceeds the level seen in every week of the last recession save for one, the week of 9/28/01. I would have some sympathy for the view that this recent upturn may have something to do with the end of Census employment, with a delay - perhaps the Census was employing some folks who would otherwise have been joining the unemployment rolls, and they're now drifting back - except that other signals are starting to look worse as well. Case in point: today's Philly Fed index.

If I believed in technical analysis on economic indicators I'd be long here.
The Philadelphia Fed composite Business Activity index, expected to come in at +7, instead came in at -7.7 (see Chart). The subindex for Number of Employees was the lowest since late last year; the Workweek index was the lowest since last summer. There is not much ambiguity here when you combine this with the Claims number. It isn't looking great (see Chart).

It's a volatile index, sure, but this is too deep a dip to dismiss.
Now, note that the Philly Fed index is pretty volatile. So this is a good time to think in terms of rejectable hypotheses. Last month, I would have said the dip is concerning, but at the limit of what might be acceptable volatility for an economy still expanding. This dip, however, is sufficiently large that I believe we can dismiss the hypothesis that the economy is still growing as strongly as it was in Q1 and Q2 (when the government was stimulating the economy, that is). At -7.7, given the volatility of the series, we can't be sure the economy is actually contracting, but at least in the Philadelphia region it is probably pretty close to zero.
Markets didn't take this news well.
The 10y note declined to 2.58% (actually, not a very strong showing all things considered) and stocks fell 1.7%. The minor melt-up on Tuesday has been fully erased. Volumes remain weak, but they did expand today compared to that seen during the up days. The VIX reached the highest level since early July. Inflation swaps and TIPS breakevens declined, although that was partly because the Treasury announced a $7bln reopening of 30y TIPS for next Monday's auction, and that was towards the upper end of dealer estimates. The current yield of bond TIPS is 1.75%, which while low is a heck of a lot higher than the 0.11% of the 5y TIPS. The issue will pull demand from investors who would rather take some bond price risk than guarantee a negative real return - long-lived accounts, like pensions, endowments, and non-US pensions. Will it be enough to place that much duration? I think it will be, but we'll see. The dealers will be timid and cheapen the issue up before the auction, and it is August.
On Friday, there is no data due but that doesn't mean the panicky government reactions cannot begin. Today President Obama said that the week's jobless claims data showed that Congress should act on a new jobs bill. You know, the last one worked so well. How about working to reduce costs on business and reduce the barriers to hiring? Just a thought, but as that would imply smaller government it isn't likely to get much of a hearing. I expect to hear more great plans over the weekend, and I expect the stock market won't much care for it. Frankly, I doubt the bond market will like it very much either.
There is nothing to say that the panic in the government and the central bank needs to lead to a market panic, but I would not be very surprised if things started heading that way.


