• 316 days Will The ECB Continue To Hike Rates?
  • 316 days Forbes: Aramco Remains Largest Company In The Middle East
  • 318 days Caltech Scientists Succesfully Beam Back Solar Power From Space
  • 718 days Could Crypto Overtake Traditional Investment?
  • 723 days Americans Still Quitting Jobs At Record Pace
  • 725 days FinTech Startups Tapping VC Money for ‘Immigrant Banking’
  • 728 days Is The Dollar Too Strong?
  • 728 days Big Tech Disappoints Investors on Earnings Calls
  • 729 days Fear And Celebration On Twitter as Musk Takes The Reins
  • 731 days China Is Quietly Trying To Distance Itself From Russia
  • 731 days Tech and Internet Giants’ Earnings In Focus After Netflix’s Stinker
  • 735 days Crypto Investors Won Big In 2021
  • 735 days The ‘Metaverse’ Economy Could be Worth $13 Trillion By 2030
  • 736 days Food Prices Are Skyrocketing As Putin’s War Persists
  • 738 days Pentagon Resignations Illustrate Our ‘Commercial’ Defense Dilemma
  • 739 days US Banks Shrug off Nearly $15 Billion In Russian Write-Offs
  • 742 days Cannabis Stocks in Holding Pattern Despite Positive Momentum
  • 743 days Is Musk A Bastion Of Free Speech Or Will His Absolutist Stance Backfire?
  • 743 days Two ETFs That Could Hedge Against Extreme Market Volatility
  • 745 days Are NFTs About To Take Over Gaming?
How Millennials Are Reshaping Real Estate

How Millennials Are Reshaping Real Estate

The real estate market is…

Is The Bull Market On Its Last Legs?

Is The Bull Market On Its Last Legs?

This aging bull market may…

  1. Home
  2. Markets
  3. Other

Watch Today's 'Triple Resistance Test' on the NASDAQ 100

On June 5, 2008 the NASDAQ 100 hit a high of 2055.82 and then it dropped over 1000 points six months later.

And then ... on April 26, 2010 the NASDAQ 100 hit an intra-day high of 2059.42 and failed the "double resistance test" by closing at 2049.09. Just over two months later it had dropped 345 points.

So now it is October 13th. 2010 ... and the NASDAQ 100 will have its "triple resistance test" today as seen on Chart #1 below. (Also see this morning's Chart #2 below.)

*** The upside resistance to take out is 2059.42 today.

A close below 2055.82 during the next few days could be followed by a failure drop in the coming months so that is the other important level to watch as well.

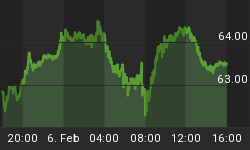
**Below is this morning's chart as of 10:20 AM (EST).

This critical test is going on now as we speak, so keep an eye on it today.


Back to homepage

Leave a comment

Leave a comment