


"I can't think about that right now. If I do, I'll go crazy. I'll think about that tomorrow." - Chancellor Merkel
Actually, that quote is from Scarlett O'Hara in Gone With The Wind, but it may as well apply to the EU leaders who announced today that the much-heralded summit meeting this weekend would be delayed until 'no later than' next Wednesday. The cited reason is that there are still some issues to be worked through before "final agreement" can be reached. I don't know about you, but that sounds like the NBA labor dispute. If they knew when they were going to reach a final agreement, then they would have reached an agreement. Methinks this is more an admission that the issues aren't so easily brushed aside as the early-week rumors of a resolution suggested. The good news is that this means we don't have to trade down into the weekend and then up on Monday (or up into the weekend and then down on Monday) on the basis of expectations set and dashed.
Europe is still hogging the headlines. The Philly Fed index was great, printing +8.7 versus -9.4 expected (-17.5 last month), on strength in New Orders and Shipments. The Number of Employees subindex, curiously, declined. This has been a wild year for Philly Fed. In March it reached a 27-year high at 43.4; in August it reached a 3-year low at -30.7. Remember that this is a relative-strength indicator: respondents describe how conditions are relative to the prior month. The huge swings show great instability in the rate of growth, due to everything from tsunamis and nuclear meltdowns to Middle Eastern riots to large-scale government intervention. I wonder if the significance of Philly Fed right now is less about its level and more about its volatility. It must be hard to make long-term investment decisions in a business when conditions are changing so violently from one month to the next.

Philly Fed has not given much insight recently,
but I wonder if the volatility implies something about visibility?
This may also be the reason behind the strong TIPS auction. While the level of real yields is awful, part of TIPS' appeal is in the option-like character of inflation. That is, if you are wrong owning TIPS here compared to nominal bonds, then you lose a little bit (we're not going to have -5% inflation for 30 years, and even if we did you'd get par back), but if inflation develops there's no reason it can't be +5% or more. So again, the uncertainty about the economy may contribute to the bid. Put another way, there may be interest from nominal bondholders who are more interested in getting a 1% real yield with certainty than some chance of a +2% real yield and some chance of a -3% real yield over the holding period of the bond.
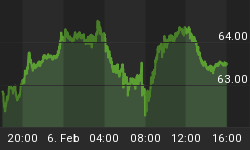
On the flip side of inflation, copper was killed today, falling more than 5%. "Doc Copper" is 34% below its highs (see Chart) and at the lowest level in a year. I think copper doesn't have the leading indicator character that it used to have (at least in legend), and I think that it isn't likely to stay down with the world awash in cash (M2 is still rising at 15.2% annualized over the last 26 weeks), but it is a warning sign that should be recognized.

Doc Copper is feeling a little run-down himself these days.
It may seem odd, after looking at copper, to address the question, "Are Commodities In A Bubble?" True to form, perhaps, I am less interested in the answer than in a way to attack the question. Commodities are not like capital market assets such as stocks and bonds which represent an ongoing source of value and a stream of income. A bond pays a coupon or interest at maturity; a stock pays dividends or (hopefully) increases in value over time as the company retains earnings. Because these instruments have definable cashflows, even if they are speculative, they can be analyzed with tools such as net present value analysis or a dividend discount model. But commodities have no 'yield to maturity.' You get no dividend from Zinc. And that means we can analyze the current value of a commodity with respect t o its supply and demand but otherwise relative value tools are scarce.
But wait, analyzing the current value of a commodity with respect to its supply and demand is already done through the mechanism of price discovery. In transparent markets, it is hard to argue that any particular price represents in itself a 'bubble' or 'deep value.' Unless there is some reason that prevents the market from clearing normally, the spot price will be driven by the utility of the good for the purposes of consumption.
(As an aside, the demand from commodity index funds that acquire risk through futures contracts does not, cannot, affect the spot price in a meaningful way. This is because for every long contract there is a short contract, and commodity index funds generally roll so as to never take delivery. This may affect futures prices and contangoes/backwardations, but not spot prices. On the other hand, ETFs that hold physical commodities may, by removing commodities from circulation, affect the spot price over time. But this is not a key part of what I am talking about today.)
So what should we mark commodities against? I choose: money.
Commodities, by their nature, should have a zero real return over (a long period of) time. A pile of copper remains a pile of copper. A bar of gold remains a bar of gold. Thus, if the price of a commodity changes over a long period of time, it is probably more accurate to say that it is the unit of account that is changing value. An ounce of gold doesn't go from $500 to $1000; a dollar goes from 1/500th of an ounce of gold to 1/1000th ounce of gold. This is, of course, the argument of hard-money adherents. I don't understand why only gold will do - and don't want to conduct that argument - but the general point is reasonable.
So we want to compare commodities over time to money. Is the price of commodities out of line given the amount of money in circulation?
This is a harder question to answer than it sounds like. The absolute amount of M2 money has grown enormously over a long period of time. In 1959, M2 was $298bln. In 1989, M2 was $3.2trillion. In 2009, $8.5 trillion. Obviously, commodities prices have not grown anything like that amount. This is because the amount of money must grow over time to maintain a constant price level, if GDP is to keep rising. Remember MV≡PQ. If velocity is stable, and prices are stable, then M must grow with output. Of course, velocity is not stable, although M2 velocity happens now to be back in the general range it inhabited from 1960-1990. And of course, in principle, the Fed doesn't want prices to be precisely stable, either, since a small amount of inflation is seen to have much lower costs and risks than a small amount of deflation. So if we plot M/Q, we expect to see it rise slowly over time. In fact we do, as the chart below shows (incidentally, don't be concerned about the units on any of these costs. They are artificial; it's the trend that matters. For example, the chart below shows how many dollars are in circulation for every dollar of output, but the axis units will be different if I use, say, 1982 dollars rather than 2005 dollars as we have here).

M2 compared to real GDP
So again, charts of commodities ought to look something like the chart above. There is more money in the system, but it's really how much more money there is relatively since a larger economy needs more money just to keep prices stable.
I compare "economy-adjusted money" to commodity prices in the chart below using the CRB (which I use mainly because it has a long price history). I think a case can be made that commodities may have been 'bubbly' in the 1970s and perhaps in 2008 they were starting to get there, but it's hard to look at this chart and see a big bubble now.

CRB compared to economy-adjusted money
Now, certain commodities might be. This is perhaps not as good a way to compare value for individual commodities because for them we also need to consider more microeconomic demand and supply and, especially, long-term changes in the supply dynamic, but we can get an idea of general trend. Live Cattle and Wheat certainly don't look bubbly. Note that if we didn't adjust Live Cattle, it looks very much like the M2/GDP chart: it slopes upward and to the right. Ditto Wheat, although to a lesser extent. Adjusted by "economy-adjusted money," both of these look about fair.

Wheat and Live Cattle (chosen for random illustration)
Crude oil between 1986 and 2003 was pretty stable, and started to look expensive thereafter. To be fair, there are some questions about long-term supply in oil (Peak Oil and all that). I won't say anything about Gold, because whatever I say makes somebody mad. You judge. I've written before about how it makes some sense to think about Gold as an in-the-money straddle on inflation.

Gold and Crude Oil have more interesting stories (and they always do).
Finally, and perhaps surprisingly, I threw in two financial assets that are often thought of as inflation hedges for different reasons. The chart below shows the adjusted ratios of stock prices and median existing home sales prices to economy-adjusted money. Home prices look pretty reasonable on a long time scale; stocks less so, but of all of these charts I have the least intuition about how stocks should look through this lens.

Is this a reasonable way to 'deflate' financial assets?
So my overall perspective is that the symptom of high prices of certain commodities and of commodities in general in no way should produce a diagnosis of a bubble in commodities. Feel free to disagree and comment...I'm not saying this is the final word on the subject!


