


Based on the June 22nd, 2012 Premium Update. Visit our archives for more gold & silver analysis.
Congratulations. Let's all take a collective deep sigh of relief. Instead of a new crisis, we're just going to keep having the same old one.
Greeks voted to stay in the European Union with a narrow victory for the center-right New Democracy party. A global crisis has been averted--for now. But as we take a deep sigh of relief let's keep in mind that the euro is already on a slippery slope to oblivion.
Let's face it. A Greek exit is already a forgone conclusion for many. Now it's Spain's turn to headline with its bond yields soaring to new euro-era highs. Spain's economy is almost twice the combined size of Greece, Ireland and Portugal, countries that have already received some form of eurozone bailouts. Spain looks poised to become a domino.
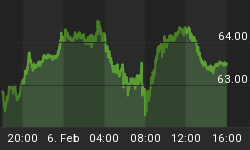
The Euro Index chart (charts courtesy by http://stockcharts.com) appears to reflect that.

In the long-term Euro Index chart, we see that as the USD Index has reversed and moved higher, the Euro Index has reversed and moved lower. The previous move above the declining red support-resistance line has been invalidated and the situation is now more bearish than not for the euro. This is consistent with a more bullish than not outlook for the dollar.
The recent rally in the Euro Index could have been based upon the improved outlook in Greece. With the New Democracy winning the election as expected, investors may now be focusing on Spain and the problems of other countries causing the implications here to be bearish. Favorable outcome of the Greek elections appears to have been in the price and we saw a "buy the rumor, sell the fact" type of action.
And the dollar? As euro declined, it rallied.

We begin this week with a look at the long-term USD Index chart (if you are reading this essay on sunshineprofits.com, you may click the above chart to enlarge). The index appears now to have completed the verification of its breakout. About one half of the previous upswing has been corrected and the index has declined more or less to the lower of the major support lines. It is now moving higher once again.

In the short-term USD Index chart, we can see the recent correction and subsequent reversal. The index closed above the short-term declining resistance line, which is the higher one - based on intra-day highs (relative to the line based on daily closing prices). The situation here is therefore bullish from a technical point of view. We don't describe it as clearly bullish because the breakout has not yet been confirmed. The index has not moved considerably above the declining support line and has only closed above it one time. Two more closes are needed to confirm the move and then the situation would be better described as very bullish.
Consequently, the situation in the USD Index is bullish and this has bearish implications for the precious metals, which you can see in the table below.

The Correlation Matrix is a tool which we have developed to analyze the impact of the currency markets and the general stock market upon the precious metals sector. We see a bit of a weaker link between gold and the USD Index this week. This link appears to be getting stronger however, based on the 10-day column.
The impacts of the currency market and the general stock market appear strongest upon silver. They likely contributed to its heavy price decline on Thursday as the USD Index rallied while stocks declined significantly. Overall, the implications going forward are bearish for the precious metals sector taking into account the USD and Euro Indices.
Before summarizing, let's take a look at one more market that can tell us something about the possible future moves of gold and silver prices. Namely, let's examine the crude oil chart.

In the June 7th, 2012 essay entitled Gold And Crude Oil Charts: Does Any Clear Picture Emerge? we wrote the following:
In this long-term chart we see that oil prices continue their breakdown. This chart suggests that oil is likely to decline much more (to 74 or likely to 65 or even lower) and that gold prices have merely seen a small pause in their downtrend, much as was the case in 2008. The implications here are bearish for gold and the entire precious metals sector.
The recent pause in declining prices for crude oil was quite understandable, as multiple support lines were in play. The consolidation now appears to be over and considerably lower prices could be seen in a trend similar to 2008. The implication here for gold is that the recent correction in gold prices could very well be over and major price declines just ahead. The situation is quite bearish for precious metals investors.
Summing up, based on the situation in the currency markets and in the crude oil, the outlook for the precious metals sector is quite unfavorable. Yes, precious metals are still in a secular bull market and are likely to move much higher eventually, but there's a huge difference between "eventually" and "now" and it seems that a decline will be seen first. More details are available in the full version of this essay.
To make sure that you are notified once the new features are implemented, and get immediate access to my free thoughts on the market, including information not available publicly, we urge you to sign up for our free e-mail list.Gold & Silver Investors should definitely join us today and additionally get free, 7-day access to the Premium Sections on our website, including valuable tools and unique charts. It's free and you may unsubscribe at any time.
Thank you for reading. Have a great and profitable week!


