


Tonight lets look at some of the positive signs that are beginning to show up that are showing a bottom might be close at hand or already in for the precious metals stocks. The first PM stock index to look at has been one of the most symmetrical in several ways. The XAU has bounced perfectly off the neckline symmetry rail and shows a nice rally maybe starting. We still can't rule out one more test of the neckline symmetry rail as alot of times there are two test of an important trendline before the real move begins. If you look at some of the other tops and bottoms on the chart below you will see what I mean.

There is another form of symmetry, on the chart above that most won't see, is both the left and right shoulders of the inverse H&S bottom are both expanding wedges. The left shoulder is a bearish expanding rising wedge and the right shoulder is a bullish expanding falling wedge. With the double headed double bottom for the absolute bottom and the two expanding wedges for the left and right shoulders gives us an awesome looking H&S bottom. If the neckline symmetry rail is showing us the low for the right shoulder we can expect at least a 100 point rally in the XAU when the neckline is broken to the upside.
The GDX is also showing a very similar setup in regards to the neckline symmetry rail. It also has two expanding wedges as it's left and right shoulders. I would like to see the MACD crossover to confirm the bottom is in.

The HUI has a similar setup to the other PM stock indexes. I've added an uptrend channel that may or may not come into play down the road.

The GDXJ small cap PM stock index show a little different look to the bigger cap stocks. It still has a double bottom with a smaller inverse H&S base. It also has an expanding falling wedge that backtested the neckline last week.

The next chart I would like to show you is a daily line chart for the HUI that shows the double bottom hump still working as support. Line charts are good for showing where real hidden support or resistance is by taking out the spikes that a bar chart can show. As you can see on the chart below the HUI is getting a nice bounce from the lower area of the brown support zone.

This next chart of the HUI shows the backtest taking place to the top blue rail of the downtrend channel. So putting some of the pieces of the puzzle together you can begin to see why I think the bottom is in for the precious metals stocks. The right shoulder, of the inverse H&S bottom is finding support on the top blue rail of the downtrend channel, is more common than most realize.

This last chart for the HUI is a long term monthly look that shows the whole bull market from the big complex H&S base to our most recent consolidation pattern, a potential bullish rising wedge halfway pattern. I have taken alot of flack in the past for showing a rising wedge as a bullish consolidation pattern but they are no different than any other consolidation pattern. If they breakout to the upside its a consolidation pattern regardless of what the rules say. Also the expanding rising and falling wedges are another pattern that most chartists miss because they are not in the book of Technical Analysis. Notice where our current inverse H&S bottom is forming, right at the 4th reversal point of the bullish rising wedge. The H&S is a reversal pattern that was needed to reverse the latest downtrend and to put in a 4th reversal point for the big blue bullish halfway pattern. Notice how much bigger the bullish rising wedge is compared to all the other consolidation patterns in red. This is a huge consolidation pattern and has been in consolidation mode since the 2008 H&S top. Big consolidation pattern equals big moves.

As the precious metals stocks are showing some bottoming action lets take a look at Silver and see if it is confirming a bottom also. This daily chart shows a nice inverse H&S bottom that has already broken out to the upside three days ago with some backtesting already taking place. The price objective is to the previous high at the 35 area.

The last chart I would like to show you is a long term look at gold that is showing a parabolic curve taking shape. If the PM stock indexes are bottoming and silver is bottoming then gold should also show a bottom. If you look at the last bar on the top right hand side of this monthly chart you can see that bar is finding support at the last uptrend rail of the parabolic rise.

From a chartology perspective there is alot of evidence that is suggesting the precious metals complex has bottomed. I know thats is a strong statement to make but that is what the charts are suggesting to me right now. The last monthly chart above is showing gold on the launch pad with the breakout and backtest of the blue triangle finishing up on the bottom black rail of the parabolic uptrend arc. This is the 5th large consolidation pattern for the 12 year bull market that is suggesting a multiple year rally lies just ahead of us. The chartology shows 3 different methodologies used for analyzing the charts above that don't show up in most text books. The neckline symmetry rail, the expanding rising and falling wedges and the bullish rising wedge. Its a little unconventional but whatever it takes to see the picture the charts are trying to show us is what its all about. All the best....Rambus.
EDITOR'S NOTE :
Rambus Chartology is Primarily a Goldbug TA Site where you can watch Rambus follow the markets on a daily basis and learn a great deal of Hands on Chartology from Rambus Tutorials and Question and Answers.
Most Members are Staunch Goldbugs who have seen Rambus in action from the 2007 to 2008 period at www.goldtent.org and now Here at Rambus Chartology since early 2012 .
To review his Work and incredible calls from the 2007-2008 period click on the top right sidebar in the "Wizard of Rambus" .."What If !!" Post
To Follow Rambus Unique Unbiased Chart Work and participate in a Chartology Form with questions and answeres and learn the Art and Science and Mindset of a Pro Trader please Join us by subscribing monthly for $29.99 at www.rambus1.com
We have many subscribers from all over the world who are glad they did as they enjoy the many daily updates and commentaries provided at this exciting new site
As you will see Rambus (Dave) has prepared us for this difficult period by being one of the only ones to see and warn about the incredibly debilitating PM smackdown as early as Jan 2 2012 .click on the" HUI Diamond in the Rough" Post in the "Wizard of Rambus" top right
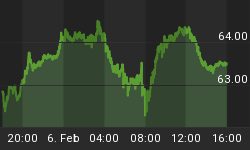
More Recently Rambus called a Bottom in HUI in this post.and has had subscribers on board for a Powerful Run to the Upside
BUT
What is he seeing Now ?
You will find Rambus to be a calm humble down home country tutor with an incredible repitoir of all the TA based protocols tempered with his own one of a kind style.simply put.He wants to keep his subscribers on the right side of these crazy volitile and downright dangerous markets
See you at the Rambus Chartology www.rambus1.com


