


The good news is:
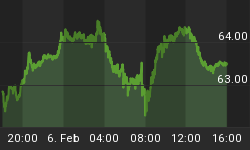
• All of the major averages closed at multi year highs on Friday, several closed at all time highs. The breadth indicators were strong and the secondaries outperformed the blue chips.
The negatives
The market is overbought.
The Dow Jones Industrial average and S&P 500 (SPX) have both been up for 6 consecutive days. The Russell 2000 has been up for 9 consecutive days.
Some of the breadth indicators are at their highs levels of the last 3 years.
The positives
The new highs were confirmed by everything that matters so higher highs are to be expected.
The chart below covers the past 6 months showing the NASDAQ composite (OTC) in blue and a 40% trend (4 day EMA) of NASDAQ new highs / (new highs + new lows) (OTC HL Ratio) in red. Dashed horizontal lines have been drawn at 10% levels for the indicator; the line is solid at the neutral 50% level.
OTC HL Ratio recovered to 92% on Friday.
There are trading systems that impose a no sell filter when variations of this indicator are above 80%.

The chart below is similar to the one above except it shows the (SPX) in red and NY HL Ratio, in blue, has been calculated from NYSE data.
NY HL Ratio recovered last week to 94%.

Seasonality
Next week includes the 5 trading days prior to the 3rd Friday of March during the 1st year of the Presidential Cycle.
The tables below show the daily return on a percentage basis for the 5 trading days prior to the 3rd Friday of March during the 1st year of the Presidential Cycle.
OTC data covers the period from 1963 - 2012 and SPX data covers the period from 1953 - 2012. There are summaries for both the 1st year of the Presidential Cycle and all years combined. Prior to 1953 the market traded 6 days a week so that data has been ignored.
Average returns have been mostly negative.
Report for the week before the 3rd Friday of March.
The number following the year is the position in the Presidential Cycle.
Daily returns from Monday through 3rd Friday.
| OTC Presidential Year 1 | ||||||
| Year | Mon | Tue | Wed | Thur | Fri | Totals |
| 1965-1 | 0.62% | 0.08% | 0.14% | 0.04% | -0.27% | 0.62% |
| 1969-1 | -0.44% | -0.22% | 0.01% | 0.47% | 0.60% | 0.43% |
| 1973-1 | -0.11% | 0.19% | 0.01% | 0.41% | -1.13% | -0.63% |
| 1977-1 | 0.12% | 0.21% | 0.20% | -0.17% | 0.02% | 0.39% |
| 1981-1 | 0.63% | -0.12% | 0.40% | 0.22% | 0.90% | 2.02% |
| 1985-1 | -0.41% | 0.08% | -1.14% | -0.27% | 0.18% | -1.56% |
| 1989-1 | 0.16% | -0.14% | 0.24% | 0.62% | -1.79% | -0.90% |
| Avg | 0.08% | 0.04% | -0.06% | 0.16% | -0.36% | -0.14% |
| 1993-1 | 0.35% | 0.04% | -1.16% | 0.00% | -0.68% | -1.45% |
| 1997-1 | -1.05% | -0.75% | -1.60% | 0.78% | -0.41% | -3.03% |
| 2001-1 | -6.30% | 4.75% | -2.12% | -1.59% | -2.57% | -7.83% |
| 2005-1 | 0.46% | -0.78% | -0.94% | 0.03% | -0.43% | -1.66% |
| 2009-1 | -1.92% | 4.14% | 1.99% | -0.52% | -1.77% | 1.92% |
| Avg | -1.69% | 1.48% | -0.77% | -0.26% | -1.17% | -2.41% |
| OTC summary for Presidential Year 1 1965 - 2009 | ||||||
| Avg | -0.66% | 0.62% | -0.33% | 0.00% | -0.61% | -0.97% |
| Win% | 50% | 58% | 58% | 67% | 33% | 42% |
| OTC summary for all years 1963 - 2012 | ||||||
| Avg | -0.19% | 0.08% | 0.00% | 0.17% | -0.10% | -0.05% |
| Win% | 48% | 56% | 64% | 72% | 50% | 56% |
| SPX Presidential Year 1 | ||||||
| Year | Mon | Tue | Wed | Thur | Fri | Totals |
| 1953-1 | 0.15% | 0.42% | -0.34% | -0.08% | -0.15% | 0.00% |
| 1957-1 | -0.66% | -0.07% | 0.66% | 0.07% | -0.05% | -0.04% |
| 1961-1 | 0.28% | -0.44% | 0.30% | 1.01% | 0.61% | 1.76% |
| 1965-1 | 0.03% | -0.13% | -0.13% | -0.24% | 0.03% | -0.42% |
| 1969-1 | 0.26% | 0.24% | 0.73% | 0.64% | -0.21% | 1.66% |
| Avg | 0.01% | 0.01% | 0.25% | 0.28% | 0.05% | 0.59 |
| 1973-1 | 0.06% | 0.54% | 0.44% | -0.75% | -0.51% | -0.21% |
| 1977-1 | 0.77% | 0.55% | 0.19% | -0.09% | -0.22% | 1.20% |
| 1981-1 | 1.18% | -0.56% | 0.22% | -0.57% | 0.46% | 0.74% |
| 1985-1 | -0.17% | 0.49% | -0.82% | -0.20% | -0.74% | -1.44% |
| 1989-1 | 0.83% | -0.06% | 0.52% | 0.93% | -2.25% | -0.03% |
| Avg | 0.53% | 0.19% | 0.11% | -0.13% | -0.65% | 0.05% |
| 1993-1 | 0.36% | -0.01% | -0.68% | 0.80% | -0.38% | 0.08% |
| 1997-1 | 0.32% | -0.76% | -0.49% | -0.40% | 0.19% | -1.14% |
| 2001-1 | -4.32% | 1.48% | -2.58% | 0.59% | -1.96% | -6.79% |
| 2005-1 | 0.56% | -0.75% | -0.81% | 0.18% | -0.05% | -0.87% |
| 2009-1 | -0.35% | 3.21% | 2.09% | -1.30% | -1.98% | 1.67% |
| Avg | -0.69% | 0.63% | -0.50% | -0.03% | -0.84% | -1.41% |
| SPX summary for Presidential Year 1 1953 - 2009 | ||||||
| Avg | -0.05% | 0.28% | -0.05% | 0.04% | -0.48% | -0.26% |
| Win% | 73% | 47% | 53% | 47% | 27% | 47% |
| SPX summary for all years 1953 - 2012 | ||||||
| Avg | 0.01% | 0.22% | 0.13% | 0.20% | 0.00% | 0.55% |
| Win% | 63% | 58% | 58% | 58% | 58% | 62% |
Money supply (M2)
The money supply chart was provided by Gordon Harms. Money supply growth has continued to decline.

Conclusion
The market is overbought and there has been modest seasonal weakness next week.
I expect the major averages to be lower on Friday March 15 than they were on Friday March 8.
Last weeks negative forecast was a miss.
This report is free to anyone who wants it, so please tell your friends. They can sign up at: http://alphaim.net/signup.html. If it is not for you, reply with REMOVE in the subject line.
Gordon Harms produces a Power Point for our local timing group meetings. You can get a copy of that at: http://www.stockmarket-ta.com/
In his latest newsletter, Jerry Minton, after heaping some well deserved abuse on the FOMC, goes on to discuss broad seasonal patterns in the market. You can sign up at: http://www.alphaim.net/
Good Luck,
YTD W 5/L 1/T 4


