


As we to prepare for the arrival of a new year, 2014 for those not keeping track, we should take time to consider reality. One part of that is to reconsider some well grounded advice: Past performance does not predict future performance. 2013 has clearly been the year of the equity fantasy, and one not enjoyable for Gold investors. An investment world focused on TWTR and bitcoins is one in which the Greater Fool Theory again dominates. With year end rapidly approaching, now is the time to consider what the numbers tell us, not the investment hype popular in the media.

Value View Gold Report

The above chart portrays the ratio of the price of $Gold to the S&P 500 back to 1945, or nearly 70 years. Solid black line is the average of that ratio. Last bar on the right is the current situation. At the present, the ratio of $Gold to the S&P 500 is at the lowest level experienced since 2008. $Gold ended that year at about $865. One should have been buying Gold at that price, and that is what it is now suggesting.
Portrayed in the bottom chart are the implications of using the above ratio's history to assess the potential for $Gold and U.S. equities. If we use the average ratio in the above chart and assume that the S&P 500 is correctly priced, then $Gold is under valued by ~70%. If we assume that $Gold is correctly priced, the S&P 500 should fall by ~40%. Of course actual results will differ from these estimates, but the relative situation is fairly obvious.
An investor should be adding Gold to portfolios and reducing exposure to U.S. equities.
Valuation is not a market timing tool. It does not tell us when market will turn, but rather when conditions are conducive for a turn to develop. For help with that tricky part of the problem, let us consider some important events in the $Gold market this year. In late June $Gold made a bear market low. In October, as should have been expected, $Gold made another important low. October is the month when sales are normally made by funds to take losses to offset gains that will be passed out to investors. That October low should have been the final test for $Gold.
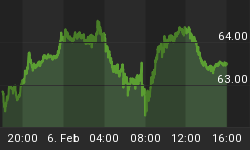
However, end of year window dressing and group-think have been stronger forces this past month than perhaps should have been the case. With equity mania in full bloom, portfolio managers have been dumping Gold and Gold stocks so they do not show either on year end financial statements that will go to investors. That tendency was made worse by the herd's belief that taper was imminent and that event would cause the dollar to rally. The combination of these two forces created an additional important low last week, at about $1,218. (Note: The patterns in Euro Gold and Pound Gold are somewhat more severe due to currency appreciation, but the situation should be viewed as similar.)
With $Gold deeply under valued relative to paper equities and the oversold conditions brought on by irrational fund selling, $Gold has been set up to benefit from the January effect. January is the month when those assets that have been pummeled in the previous Fall stage a recovery. $Gold could conceivably move by a significant amount between now and the third week in January.
As we close, remember to take a moment of silence on 23 December to remember back 100 years to when the dollar had value. On that day in 1913 the Federal Reserve came into being. Ever since that event the value of the dollar has been falling and the economic instability of the world has been rising. When an experiment has failed over a complete century, has not the time for change arrived?
Ned W. Schmidt, CFA has had for more than two decades a mission to save investors from the regular financial crises created by Keynesianism, and the high priests of that misguided ideology. He is publisher of The Value View Gold Report. To receive these reports, go to: www.valueviewgoldreport.com Follow us @vvgoldreport


