


The illiquid trading of December is already well in evidence - and we haven't even reached the bad part yet. One we are past the CPI report and the Fed meeting, there will be a few days where serious traders are squaring up based on what they now believe after those data points. After that, it will get truly quiet for the last couple of weeks.
A little quiet is what the energy market needs. On Monday front Crude broke to new six-year lows. Not since oil bottomed at $32.40 in December 2008 have prices been this low. Prior to that, the last time we saw sub-$40 oil was in July 2004. Ditto with gasoline prices, which are averaging just a touch above $2/gallon nationwide. This is truly amazing, and is causing all sorts of carnage in energy and energy service companies as has been widely reported.
What is interesting, though, and has been widely unreported has been the impact these recent price declines have had on inflation expectations as impounded in the price of inflation derivatives and TIPS breakevens. In short: not very much.
In prior episodes, such as last year at about this time, plunging energy quotations affected not only near-term inflation expectations but also long-term inflation expectations. The reason that near-term breakevens, or say 1-year inflation swaps, respond to energy prices is very simple: these contracts are pegged to headline inflation, which includes energy; while the market tends to overreact to the energy effect it tends to price fairly efficiency the near-term effect of movements in gasoline on actual inflation outturns.
But it makes very little sense that even very large moves in gasoline prices should be reflected in long-term inflation expectations. This is for two reasons: first, energy prices are mean-reverting, so declining prices in one year are more likely to see appreciating prices the following year (or, at least, big declines tend not to be followed by big declines). Second, even a significant change in energy prices, amortized over ten years for example, ends up not being a very big movement per year when you then also take into account how low the pass-through is from energy prices to inflation swap prices.
A bunch of this is sort of "inside baseball" talk to inflation traders, which I know isn't my audience for the most part. But you can readily understand, I think, that if gasoline prices drop 50% in one year - and if we don't expect them to continue to drop 50% in every year - then that's only around a 5% movement per year in energy prices, averaged over ten years. That's like saying gasoline prices rise a dime per year for ten years. Do you think that would have, or should have, a big effect on your overall inflation expectations?
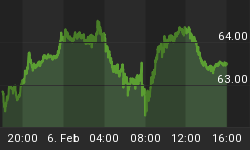
In practice, it turns out to affect the market. The chart below (source: Bloomberg) shows the national average gasoline price (in white) from the American Automobile Association versus the 10-year breakeven (that is, the difference in the 10-year Treasury yield minus the 10-year TIPS yield, a number that approximates the inflation required to break even between these two investments). You can see that this is a fairly tight relationship in the grand scheme of things. When gasoline prices fell from $3.60 to $2.00 in 2014-15, breakevens plunged from 2.20% to 1.60%. As I have just pointed out, that's larger than makes sense but the direction makes sense.

This phenomenon, incidentally, is why we (meaning me, and my company when we are doing analysis) strip out the implied energy effect by using futures quotes, so as to come up with an implied core inflation curve. (And you can actually hedge, so you can create something that looks very much like core inflation rather than headline inflation). By doing this, we can often see when the inflation market is overpricing the energy effect or underpricing it, and indeed this can be traded as part of an institutional investment strategy.
But recently, we haven't really needed to be so fine with the calculation. Notice on the right side of the chart above that over the last couple of months inflation expectations (breakevens) have risen even as crude and gasoline prices have continued to slide. The chart illustrates how unusual this is. What this means is that expectations for long-term core inflation have been rising - investors are actually looking past the near-term energy washout and saying "we don't believe this will be sustained, and even if it is we don't believe that core inflation will average 1.25% for five years." That's what was being priced in late October; now that figure is a still low but much more-sensible 1.5%.
Will investors be right? I must say that we have been aggressive in saying that being long at these breakeven levels leaves few ways to lose, at least for investors who can hold through the bumps. And inflation has long upper tails, so that even if you think 1.50% for five years is fair, you should be willing to pay a bit more simply because a miss on the high side is likely to be a worse miss than a miss on the low side.
Sadly, the only way for retail investors to position explicitly for this is through the ETF RINF, which is the Proshares 30y breakeven spread, and the bid/offer is intimidating as is the expense ratio. But it's something.
What I find fascinating is that this is happening at all. Everyone professes to believe that the Fed is ahead of the curve and will surely squash inflation. But that isn't how they're positioning.
You can follow me @inflation_guy!
Enduring Investments is a registered investment adviser that specializes in solving inflation-related problems. Fill out the contact form at http://www.EnduringInvestments.com/contact and we will send you our latest Quarterly Inflation Outlook. And if you make sure to put your physical mailing address in the "comment" section of the contact form, we will also send you a copy of Michael Ashton's book "Maestro, My Ass!"


