


Market Summary
Typically we should be in the slowest time of the year, but not so in 2016, as the summer has marked some of the most engaging price action in recent memory. The overall pattern remains in place. The market sells off on headline news and then bounces back after economic data reports continued economic growth. The Dow Jones Industrial Average edged higher Friday to post its fourth straight record close, while the S&P 500 broke its win streak as the rally lost strength ahead of the weekend. For the week, the S&P 500 and Nasdaq Indexes both rose 1.5%. The Blue Chip-heavy Dow Jones Industrial Average climbed 2%. The small cap Russell 2000 led all the major indexes jumping 2.5%. After the recent historical price rebound all the major equity indexes are finally above water for the year.

A standard chart that we use to help confirm the overall market trend is the Momentum Factor ETF (MTUM) chart. Momentum Factor ETF is an investment that seeks to track the investment results of an index composed of U.S. large- and mid-capitalization stocks exhibiting relatively higher price momentum. This type of momentum fund is considered a reliable proxy for the general stock market trend. We prefer to use the Heikin-Ashi format to display the Momentum Factor ETF. Heikin-Ashi candlestick charts are designed to filter out volatility in an effort to better capture the true trend. The updated chart below shows the stock market is extremely overbought to the level where prices usually pause. Notice that already the price uptrend is stalling and starting to move sideways. Plus, as noted, upward momentum is has turned flat.

In the chart below the DOW Transportation index is starting to diverge from the Dow Jones Industrial Average. We look for DOW Transports and Industrials to move in synch for confirmation of the current trend. Technically, whenever these prices pull away from each other, it is considered a weakening trend. If the Transports follow through on the pullback that is another signal the upward move is losing steam.

In the chart below, gold snapped a six-week rally Friday, posting their first weekly loss in almost two months, as the world reacted to another gruesome terror attack in France. "It seems terror news does not affect gold or safe havens," said Chintan Karnani, chief market analyst at Insignia Consultants. "Investors are already investing cautiously. Hence there is no mad rush towards safe havens these days." For now, gold traders "seem to prefer the racier stock markets over safe-haven assets, and with U.S. data coming in stronger than expected, there is even less desire to bid gold at these still-elevated levels," said Fawad Razaqzada, technical analyst at Forex.com.

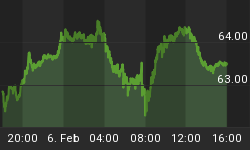
Observe in the chart below how treasury prices fell this week, pushing yields up by the largest amount in six weeks, following reports of improving economic data along with a record-setting rally in equities prompted investors to sell government debt. Treasuries dropped to the lowest level since right after the Brexit vote and after a flurry of upbeat U.S. economic data outweighed any safe-haven buying in response to the Paris terrorist attack.

Market Outlook
The rebound in stock prices and the new record highs set by the S&P 500 and the Dow Jones Industrials have had a positive impact on money managers. Other investors are encouraged by the sustained economic growth. A view that there is there is no viable alternative to stocks is contributing to the optimism. Giving reason for caution or pessimism is global economic uncertainty, the prevailing level of valuations and concern about corporate earnings growth. The presidential election and monetary policy are also impacting investor sentiment. Last week we reported "...The equity market is telling you the second quarter economy looks better than the first quarter," said Art Hogan, chief market strategist at Wunderlich Securities in New York. He said if earnings season, which begins in earnest next week, provides investors with a strong outlook; the S&P will likely break the record and has a chance at rallying from there. "The old high has been resistance and if you break it and see earnings growth and relatively good guidance, people will probably try to get in front of that," said Hogan..." In the 3rd quarter graph below investors are trading "risk-on", reversing the trend of buying safe-haven assets like gold and bonds and aggressively investing in all types of equities.

The CBOE Volatility Index (VIX) is known as the market's "fear gauge" because it tracks the expected volatility priced into short-term S&P 500 Index options. When stocks stumble, the uptick in volatility and the demand for index put options tends to drive up the price of options premiums and sends the VIX higher. The 'Fear Gauge' continues to exhibit little concern for any downside risk at this point. Since peaking right after the June 23rd Brexit vote, you can see in the graph below, as the S&P achieved all-time highs the Volatility Index has sank to the lowest level since last summer. As long as stocks remain near lofty heights, expect the VIX to remain suppressed as investors are complacent.

The American Association of Individual Investors (AAII) Sentiment Survey measures the percentage of individual investors who are bullish, bearish, and neutral on the stock market for the next six months; individuals are polled from the ranks of the AAII membership on a weekly basis. The current survey result is for the week ending 07/13/2016. Optimism among individual investors about the short-term direction of stock prices is at a level not seen in over four months, according to the latest AAII Sentiment Survey. Meanwhile, neutral sentiment and bearish sentiment both declined. Bullish sentiment, expectations that stock prices will rise over the next six months, jumped 5.8 percentage points to 36.9%. Optimism was last higher on March 9, 2016 (37.4%). Even with this week's increase, bullish sentiment remains below its historical average of 38.5% for the 36th consecutive week and the 69th out of the past 71 weeks. Neutral sentiment, expectations that stock prices will stay essentially unchanged over the next six months, pulled back by 3.6 percentage points to 38.7%. Neutral sentiment is above its historical average of 31.0% for the 24th consecutive week. Bearish sentiment, expectations that stock prices will fall over the next six months, declined 2.2 percentage points to 24.4%. Pessimism was last lower on since April 20, 2016 (23.9%). The historical average is 30.5%. Since registering 22.0% on June 22, 2016, optimism has rebounded by 14.9 percentage points. Though it's a big move, some context is needed. First, as noted above, bullish sentiment remains below average. Secondly, this is just the second time since last November that optimism has exceeded 30% on consecutive weeks. Bullish sentiment was above 30% during the three-week span of February 24 through March 9, 2016.

The National Association of Active Investment Managers (NAAIM) Exposure Index represents the average exposure to US Equity markets reported by NAAIM members. The blue bars depict a two-week moving average of the NAAIM managers' responses. As the name indicates, the NAAIM Exposure Index provides insight into the actual adjustments active risk managers have made to client accounts over the past two weeks. The current survey result is for the week ending 07/13/2016. Second-quarter NAAIM exposure index averaged 60.52%. Last week the NAAIM exposure index was 65.43%, and the current week's exposure is 96.52%. You can see in the graph below that professional money managers have gone "all in" and are almost fulling invested in stocks, this supports the historic market rebound over the past few weeks. But if there is a selloff the market will fall hard and fast as money managers will look to rapidly unwind their positons. Also, there is minimal opportunity for further stock accumulation as investors already have most of their funds in the market, this supports the analysis suggesting upward price movement is due for a pause.

Trading Strategy
"The Fed is playing a huge part in this rally," says Sheraz Mian, head of research at Zacks Investment Research. Fears of a Brexit driven economic slowdown, which would put further pressure on earnings, have nevertheless (paradoxically) given investors a reason to buy stocks, Mian says. Investors would much rather buy high dividend paying stocks instead of continuing to hold U.S. government bonds paying historically-low interest rates. Over the next few weeks we will find out whether last week's forecast comes to fruition when we stated "...According to the Stock Trader's Almanac the average price tendency is for a summer sell-off that usually begins in mid-July and lasts until mid-October...Mid-July is also when we typically kick off earnings season, where a strong early month rally can fade...If this analysis plays out that might be another opportune time to bid on shares..." "We have had a really, really good week, and the market is getting tired," said Mark Kepner, managing director of sales and trading at Themis Trading. "But bonds sold off a fair amount and the rally in stocks seems a bit long in the tooth. A pullback from here would not be surprising."

Feel free to contact me with questions,


