


Market Summary
This week was second-largest weekly drop for the Dow this year, and the largest for the S&P 500 since early February. Friday's broad selloff puts the Dow Industrials at a weekly loss of 2.2%, the S&P 500 at a 2.4% loss, while the Midcap S&P 400 moved down 2.1%. The small cap Russell 2000 fell 1.6% and the Nasdaq at a 2.4% decline. Despite this week's carnage, all the major asset classes remain in the black year-to-date.

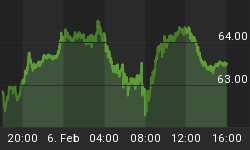
In the chart below you can see that the dollar is rebounding against most of its rivals after Boston Federal Reserve President Eric Rosengren said a "reasonable case can be made" for raising interest rates. Gold declined for a third straight day on Friday, but was able to salvage a slim weekly gain as traders looked to a cadre of Federal Reserve speakers for clues on the near-term fate of interest rates. The divergence between U.S. monetary policy direction, which is headed higher, and the policy tilt elsewhere, including in Europe and Japan, remains a key driver in metals and foreign-exchange trading. Treasury prices plunged this week—pushing yields to their highest level since the U.K.'s vote to leave the European Union—as the market's interest-rate hike expectations rose following hawkish comments from Federal Reserve officials. The flurry of comments added to selling pressures in the Treasury market, which started a day earlier after the European Central Bank passed on providing further monetary stimulus. ECB inaction caused. As a result, over the week Treasury prices fell by the most in a month.

Put/Call Ratio is the ratio of trading volume of put options to call options. The Put/Call Ratio has long been viewed as an indicator of investor sentiment in the markets. Times where the number of traded call options outpaces the number of traded put options would signal a bullish sentiment, and vice versa. Changes or swings in the ratio are seen as instances of great importance as this is commonly viewed as a change in the tide of overall market sentiment. The current ratio signals investors are concerned about are market pullback as they are buying put option contracts to hedge against prices continuing to fall.

The CBOE Volatility Index (VIX) is known as the market's "fear gauge" because it tracks the expected volatility priced into short-term S&P 500 Index options. When stocks stumble, the uptick in volatility and the demand for index put options tends to drive up the price of options premiums and sends the VIX higher. Implied volatility on Wall Street, as measured by the CBOE Volatility index on Friday, soared 30% to 16.35, the steepest increase since June 24, the day Britain voted to leave the European Union, in a referendum dubbed Brexit. Investors tend to be more fretful of VIX readings of 20 or above, but Friday's jump was significant for the so-called fear gauge for Wall Street, considering that it has remained around 12 for a sustained period. Also note the last time the S&P 500 index dropped this hard was during the Brexit fallout.

The American Association of Individual Investors (AAII) Sentiment Survey measures the percentage of individual investors who are bullish, bearish, and neutral on the stock market for the next six months; individuals are polled from the ranks of the AAII membership on a weekly basis. The current survey result is for the week ending 09/07/2016. The proportion of individual investors describing their short-term outlook for stocks as "neutral" is at its highest level in a month, according to the latest AAII Sentiment Survey. Optimism rebounded, while pessimism fell. Bullish sentiment, expectations that stock prices will rise over the next six months, rebounded by 1.1 percentage points to 29.7%. This is the third consecutive week that optimism is below 30%. It is also the 77th week out of the past 79 with a bullish sentiment reading below its historical average of 38.5%. Neutral sentiment, expectations that stock prices will stay essentially unchanged over the next six months, rose by 1.9 percentage points to 41.8%. Neutral sentiment was last higher on August 3, 2016 (43.4%). The rise keeps neutral sentiment above its historical average of 31.0% for the 32nd consecutive week. Bearish sentiment, expectations that stock prices will fall over the next six months, fell by 3.0 percentage points to 28.5%. This week's decrease puts bearish sentiment back below its historical average of 30.5% for the ninth time in 10 weeks. The NASDAQ's record highs did not have a significant impact on individual investor sentiment. One reason why is that the record highs occurred during the latter half of the survey period. Likely playing a bigger role are concerns about valuations and/or the presidential election.

The National Association of Active Investment Managers (NAAIM) Exposure Index represents the average exposure to US Equity markets reported by NAAIM members. The blue bars depict a two-week moving average of the NAAIM managers' responses. As the name indicates, the NAAIM Exposure Index provides insight into the actual adjustments active risk managers 7have made to client accounts over the past two weeks. The current survey result is for the week ending 09/07/2016. Second-quarter NAAIM exposure index averaged 60.52%. Last week the NAAIM exposure index was 88.10%, and the current week's exposure is 90.85%. Money managers appear to be betting that the Fed will not raise interest rates at the next FOMC meeting in a few weeks. Investors have proven that they want low rates to continue and will keep funds invested in equities at the expense of the bond market.

Trading Strategy
Recently we have been recommending hedging long-term bullish positions to protect gains in the event of a market pullback like we have now. The updated chart below shows 9 out of the 10 S&P sectors are in negative territory over the past month. The width of the current pullback signals it has legs and might continue for a while. Investors are nervous about whether the Fed will raise interest rates. Also giving them reason to be cautious, are global economic uncertainty and disappointment with corporate earnings growth.

Feel free to contact me with questions,


