


The good news is:
• The NASDAQ composite (OTC) and S&P 500 (SPX) both closed at all time highs last Friday.
The Negatives
In spite of an up week for all of the major indices New Highs on both of the major exchanges continued to decline.
The chart below covers the past 6 months showing the OTC in blue and a 10% trend (19 day EMA) of NASDAQ new highs (OTC NH) in green. Dashed vertical lines have been drawn on the 1st. trading day of each month.
OTC NH continued falling in spite of a strong week for the index.

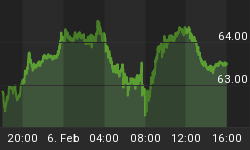
The next chart is similar to the one above except it shows the SPX in red and NY NH, in green, has been calculated with NYSE data.
The collapse of NY NH was arrested last week, but considering the index finished the week at an all time high, the performance was unimpressive.

The Positives
While new highs have been collapsing, new lows have also been declining.
The next chart covers the past 6 months showing the OTC in blue and a 40% trend (4 day EMA) of NASDAQ new highs divided by new highs + new lows (OTC HL Ratio), in red. Dashed horizontal lines have been drawn at 10% levels for the indicator; the line is solid at the 50%, neutral, level.
OTC HL Ratio rose to a comfortable 82%.

The next chart is similar to the first one except it shows the SPX in red and NY HL Ratio, in blue, has been calculated from NYSE data.
NY HL Ratio rose to over 90%. Nothing really bad is likely to happen from this level.

Seasonality
Next week includes the 5 trading days prior to the 2nd Friday of January during the 1st year of the Presidential Cycle. The tables below show the daily change, on a percentage basis for that period.
OTC data covers the period from 1963 to 2015 while SPX data runs from 1953 to 2015. There are summaries for both the 4th year of the Presidential Cycle and all years combined. Prior to 1953 the market traded 6 days a week so that data has been ignored.
Average returns for the coming week have been modest and better for small caps than large caps.
Report for the week before the 2nd Friday of January.
The number following the year is the position in the Presidential Cycle.
Daily returns from Monday to 2nd Friday.
| OTC Presidential Year 1 | ||||||
| Year | Mon | Tue | Wed | Thur | Fri | Totals |
| 1965-1 | 0.31% | 0.65% | 0.55% | 0.55% | 0.31% | 2.37% |
| 1969-1 | 0.21% | -1.10% | -0.93% | -1.97% | -0.25% | -4.04% |
| 1973-1 | 0.35% | 0.08% | -0.02% | 0.05% | 0.57% | 1.03% |
| 1977-1 | -0.23% | -0.92% | -0.40% | 0.85% | 0.37% | -0.33% |
| 1981-1 | 0.30% | -0.05% | -3.29% | -0.74% | 0.90% | -2.87% |
| 1985-1 | -0.06% | -0.02% | 0.54% | 1.34% | 0.60% | 2.41% |
| 1989-1 | 0.14% | -0.18% | 0.19% | 0.44% | 0.02% | 0.61% |
| 1993-1 | 0.77% | -0.43% | 1.08% | 1.30% | 0.21% | 2.92% |
| Avg | 0.18% | -0.32% | -0.38% | 0.64% | 0.42% | 0.55% |
| 1997-1 | 0.43% | 0.86% | -0.55% | 0.44% | 0.44% | 1.62% |
| 2001-1 | -0.49% | 1.89% | 3.40% | 4.61% | -0.53% | 8.88% |
| 2005-1 | 0.40% | -0.83% | 0.62% | -1.05% | 0.84% | -0.02% |
| 2009-1 | -0.26% | 1.50% | -3.23% | 1.12% | -2.81% | -3.67% |
| 2013-1 | -0.09% | -0.23% | 0.45% | 0.51% | 0.12% | 0.77% |
| Avg | 0.00% | 0.64% | 0.14% | 1.13% | -0.39% | 1.52% |
| OTC summary for Presidential Year 1 1965 - 2013 | ||||||
| Avg | 0.14% | 0.09% | -0.12% | 0.57% | 0.06% | 0.74% |
| Win% | 62% | 38% | 54% | 77% | 77% | 62% |
| OTC summary for all years 1963 - 2016 | ||||||
| Avg | 0.31% | -0.08% | -0.07% | 0.52% | 0.12% | 0.82% |
| Win% | 63% | 54% | 52% | 74% | 67% | 63% |
| SPX Presidential Year 1 | ||||||
| Year | Mon | Tue | Wed | Thur | Fri | Totals |
| 1953-1 | 0.45% | -0.68% | -0.42% | -0.15% | -0.95% | -1.74% |
| 1957-1 | -0.51% | -0.37% | -0.19% | 0.24% | -0.19% | -1.03% |
| 1961-1 | 0.56% | 0.27% | 0.29% | 0.30% | 0.47% | 1.90% |
| 1965-1 | 0.04% | 0.25% | 0.27% | 0.00% | 0.43% | 0.98% |
| 1969-1 | -1.46% | -1.22% | -0.41% | 0.42% | -0.29% | -2.97% |
| 1973-1 | -0.02% | -0.10% | -0.25% | 0.68% | -0.78% | -0.47% |
| Avg | -0.28% | -0.23% | -0.06% | 0.41% | -0.07% | -0.32% |
| 1977-1 | 0.18% | -1.03% | -0.69% | 0.77% | -0.18% | -0.95% |
| 1981-1 | 1.20% | 0.11% | -2.20% | -1.50% | 0.32% | -2.08% |
| 1985-1 | 0.34% | -0.15% | 0.73% | 1.89% | -0.24% | 2.57% |
| 1989-1 | 0.11% | -0.21% | 0.58% | 0.41% | 0.25% | 1.14% |
| 1993-1 | 0.44% | 0.02% | 0.46% | 0.67% | 0.28% | 1.87% |
| Avg | 0.45% | -0.25% | -0.22% | 0.45% | 0.08% | 0.51% |
| 1997-1 | -0.05% | 0.75% | -0.64% | 0.86% | 0.61% | 1.53% |
| 2001-1 | -0.19% | 0.38% | 0.96% | 1.03% | -0.64% | 1.54% |
| 2005-1 | 0.34% | -0.61% | 0.40% | -0.86% | 0.60% | -0.13% |
| 2009-1 | -0.47% | 0.78% | -3.00% | 0.34% | -2.13% | -4.48% |
| 2013-1 | -0.31% | -0.32% | 0.27% | 0.76% | 0.00% | 0.38% |
| Avg | -0.14% | 0.20% | -0.40% | 0.43% | -0.31% | -0.23% |
| SPX summary for Presidential Year 1 1953 - 2013 | ||||||
| Avg | 0.04% | -0.13% | -0.24% | 0.39% | -0.15% | -0.12% |
| Win% | 56% | 44% | 50% | 80% | 44% | 50% |
| SPX summary for all years 1953 - 2016 | ||||||
| Avg | 0.08% | -0.16% | -0.24% | 0.30% | 0.00% | -0.03% |
| Win% | 56% | 41% | 44% | 73% | 52% | 52% |
Conclusion
The continued deterioration of new highs is troublesome while the simultaneous deterioration of new lows is reassuring.
I expect the major averages to be higher on Friday January 13 than they were on Friday January 6.
These reports are archived at: http://www.safehaven.com/
Good Luck,
YTD W 1 / L 0 / T 0


