• 313 days Will The ECB Continue To Hike Rates?
  • 313 days Forbes: Aramco Remains Largest Company In The Middle East
  • 315 days Caltech Scientists Succesfully Beam Back Solar Power From Space
  • 715 days Could Crypto Overtake Traditional Investment?
  • 719 days Americans Still Quitting Jobs At Record Pace
  • 721 days FinTech Startups Tapping VC Money for ‘Immigrant Banking’
  • 724 days Is The Dollar Too Strong?
  • 725 days Big Tech Disappoints Investors on Earnings Calls
  • 726 days Fear And Celebration On Twitter as Musk Takes The Reins
  • 727 days China Is Quietly Trying To Distance Itself From Russia
  • 728 days Tech and Internet Giants’ Earnings In Focus After Netflix’s Stinker
  • 732 days Crypto Investors Won Big In 2021
  • 732 days The ‘Metaverse’ Economy Could be Worth $13 Trillion By 2030
  • 733 days Food Prices Are Skyrocketing As Putin’s War Persists
  • 735 days Pentagon Resignations Illustrate Our ‘Commercial’ Defense Dilemma
  • 735 days US Banks Shrug off Nearly $15 Billion In Russian Write-Offs
  • 739 days Cannabis Stocks in Holding Pattern Despite Positive Momentum
  • 739 days Is Musk A Bastion Of Free Speech Or Will His Absolutist Stance Backfire?
  • 740 days Two ETFs That Could Hedge Against Extreme Market Volatility
  • 742 days Are NFTs About To Take Over Gaming?
Another Retail Giant Bites The Dust

Another Retail Giant Bites The Dust

Forever 21 filed for Chapter…

Zombie Foreclosures On The Rise In The U.S.

Zombie Foreclosures On The Rise In The U.S.

During the quarter there were…

Is The Bull Market On Its Last Legs?

Is The Bull Market On Its Last Legs?

This aging bull market may…

  1. Home
  2. Markets
  3. Other

Elliott Wave Analysis: AUDUSD and SP500

AUDUSD

Aussie is finally breaking lower, now in sharp decline through 0.7600 which looks like a third wave in the middle of an impulsive bearish trend. As such, we think that there is room for more weakness in sessions ahead, down to 0.7500 for a black wave 3, while market stays below 0.7637.

AUDUSD, 1h

AUD/USD 1-Hour Chart


S&P500

E-mini S&P500 is in a corrective retracement, ideally wave four which already has three subwaves from the high but there is room for a fall to 2385 from where uptrend can resume during the US hours.
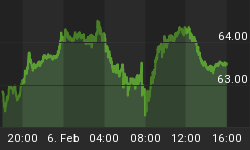
S&P500, 1h

S&P500 1-Hour Chart


Visit our website and Get more charts and forecasts with free access through 14-Day Trial Offer
You can also follow us on twitter @ewforecast
www.ew-forecast.com


Back to homepage

Leave a comment

Leave a comment