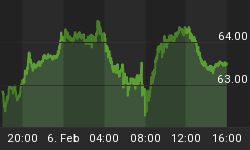
Nervous gold bugs have seen the metal decline in price from a recent high just under $1300 to the low $1240s - we expect price to turn to the upside very soon and start to pressure a number of resistances. Unlike most analysts we don’t make absolute predictions in terms of time or price, instead preferring to closely watch the markets via our charts for signs that others may not always pick up.
We use Median Line Analysis to follow the trend of the market - to accurately show the path of price. Having established this trend we look for strengthening or weakening of price within the trend. As an example, we are currently following Gold on the 20 minute timeframe shown in Chart 1. Price is running neatly in the channel between the two green Sliding Parallels with the lower one providing Support and the higher one acting as Resistance. If price moves outside the established channel it will tell us of a strengthening or weakening of trend and will be an early warning (or Canary in the Mine) as to the next likely move in Gold. If we see price breaking through the Upper Sliding Parallel, and particularly if it backtests the line having done so, we would look for price to continue higher and would look to draw a Pitchfork to the upside in order to monitor such a move......
So what are the "Steps to Heaven" or the challenges that price has to overcome in order to start moving strongly to the upside.
First of all, let’s step back a little bit and look at why we saw the move to the downside from just under $1300. Have a look at Chart 2 which is on a Weekly timeframe. The Trendline from the all-time high through the 2016 peak was just too obvious - everyone saw it and knew about it. What happened is that price inched slightly above the line - you can bet your bottom dollar that breakout traders were getting long there, and the pundits were raving about the six year decline now turning into the strongest bull market of all time. And then price reversed..... This constantly happens and it really should not come as too much of a surprise whether you believe in Central Banks conspiring to hold down the Gold price or whether you are a technical analyst.
Now we need to look at the levels that need to be overcome in order for price to move higher:
Step 1 - Price needs to move out of the 20 min downtrend shown in Chart 1 by breaching the green Sliding Parallel to the Upside.
Step 2 - Price needs to move above the P level of 1257 of the 240 min AB=CD Formation as shown in Chart 3. The P level is 50 % of the distance between C and D of the Formation. You can see that this level has previously provided Resistance, so it would be Bullish if price pushed through there and if it also found Support along that line....
Step 3 - This is another AB=CD Formation, but this time on a Daily timeframe and can be seen in Chart 4. You will see that this time the Formation is to the Upside, but once again the P level is standing out as a line of Resistance to be overcome. We have seen two previous rejections of this 1290 level and again, as with Chart 3, moving through this and particularly finding Support at this level would be Bullish....
Step 4 - You can bet that most traders and analysts are going to be fixated by the downtrend line already shown in Chart 2 and also by the proximity to the $1300 round number. But have a look just a little bit higher at the 1308 level shown in Chart 5 on a Weekly timeframe - you can see that from 2011 it has repeatedly acted as a line of both Support and Resistance. Should price succeed in pushing above this line, we would then look to see if it became Support once again...
As you can see, we are looking at a number of Resistances and using a number of technical tools to identify them. Our principal analysis uses Median Lines or Pitchforks to identify trends, Supports and Resistances and high-probability, low risk entries and exits for Traders and Investors.
If you would like to find out more please have a look at our website www.forex-analytics.com or follow us on Twitter @ForexAnalytics1
We also host monthly Free Public Webinars and you can find a recording of the latest one here: https://vimeo.com/220516331
If you would like to Register for our next Free Webinar , please do so here: https://attendee.gotowebinar.com/register/895415164930210305


