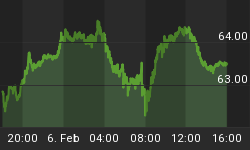
February is a month known for consolidating or correcting previous upside runs in the gold stocks, an observation we discussed in our previous commentary last week. Historically, February is often used to work off the excess "froth" from the upside runs and to put the sector back on a more even keel, technically. This correction, sorely needed in the gold stock sector, is now underway
The week of Feb. 6-10 proved to be a rough one for gold and the gold mining stocks. The XAU gold/silver index fell from its recent high above the 150 level to a low for the week below the 140 level and its 30-day moving average. Spot gold closed the latest week at $550, about $20 below its recent high earlier this month.
First, a short-term technical observation on gold. We pointed out a couple of weeks ago that gold broke out above the upper boundary of its parallel uptrend channel recently. This effort (an upside "channel buster") served to temporarily exhausted the market and now that spot gold has pulled back inside the channel it's time to assess whether the correction has run its course or whether further downside potential remains.
Before the correction began, the spot gold index had pulled too far away from its 200-day moving average. This normally precedes a correction and it will be healthy for the gold price to move closer in line with the 200-day MA. A move down to $510 to test the 90-day MA would not be surprising.
The popular streetTracks gold ETF (GLD) closed Friday, Feb. 10, at 54.79 near a 4-week low and right at its 30-day moving average. GLD has signaled that a correction has begun that should eventually take it down to test the 90-day moving average, which is currently just above the 50 level. (As an aside, according to data released by the World Gold Council, over 75% in the growth in demand for gold in the third quarter of 2005 came from gold ETFs. The streetTracks gold ETF (GLD), the fastest growing ETF in U.S. history, according to Dodson has to actually hold the bullion (289 tons worth)).
Spot silver meanwhile closed the latest week at $9.35, testing the lower boundary of its 4-month uptrend channel. Silver broke twice above the upper boundary of its uptrend channel (once in December and again at the end of January) to form a double channel buster. This normally exhausts the immediate-term uptrend and now silver could decline further to test the 90-day MA near the $9.50 level before its correction is over.

The XAU gold/silver index was also negatively impacted by last week's correction and will likely require more time to work off the remaining excesses from the recent upside run, which put the gold and silver shares into an extremely "overbought" technical condition. One measure of this overbought excess can be seen in the 50-day MA indicator for the gold shares. This indicator is simply a measure of how many of the 50 actively traded mining stocks I cover are below their respective 50-day moving averages each Friday at the close of the latest week of trading. Whenever a very large number of gold stocks are below the 50-day MA, it denotes an "oversold" market condition which normally occurs at bottoms and presages a turnaround. But after an extended rally phase, the number of gold stocks below the 50-day MA will naturally decline until finally, hardly any of them are below it.
This phenomenon was observed in the past few weeks in the gold stock sector. For example, when the most recent bottom was made in late October, there were as many as 25 of the 50 gold stocks below the 50-day MA (on Oct. 21, 2005). When the gold shares finally turned around in November and began running higher in December and January, the number of stocks below the 50-day MA started decreasing. On Nov. 4 there were still 23 stocks below the 50-day MA, then 21 below the 50-day MA on Nov. 11. By Nov. 25 the number of stocks below the 50-day MA had fallen to just eight. This was followed by a brief lateral consolidation and then a further rally in December.
By January 6, there was only one gold stock below the 50-day MA, a condition which continued the following week. On Jan. 20 there were three gold stocks below the 50-day MA, then two on Jan. 27, then three on Feb. 3. That's quite a few weeks of a very overbought market condition and now the sector is showing the signs of this wear and tear. My observation has been that whenever the market stays overbought for a long time, the correction that eventually follows usually makes up for it on the downside before ending. (FYI, as of Friday, Feb. 10, there were nine gold stocks below the 50-day MA. That's an improvement but we'll need to see quite a few more below the 50-day MA before we can say the market is "oversold" once again).


