 |
Gold •583 days | 2,368.70 | +35.30 | +1.51% |
 |
Platinum •15 mins | 2,099.40 | +28.80 | +1.39% |
 |
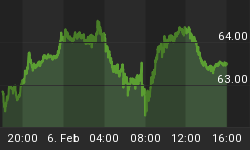
WTI Crude •13 hours | 63.55 | +0.26 | +0.41% |
 |
Gasoline •13 hours | 1.953 | +0.027 | +1.38% |
 |
Ethanol •583 days | 2.161 | +0.000 | +0.00% |
 |
Silver •583 days | 30.82 | +1.16 | +3.92% |
 |
Silver • 583 days | 30.82 | +1.16 | +3.92% | |
 |
Copper • 583 days | 4.530 | +0.111 | +2.51% | |
 |
Brent Crude • 12 hours | 68.05 | +0.50 | +0.74% | |
 |
Natural Gas • 13 hours | 3.422 | -0.087 | -2.48% | |
 |
Heating Oil • 13 hours | 2.413 | +0.020 | +0.84% |

Article Archive | Page 1127

Carefully Watch The NYA Index?
While the other indexes are typically showing levels above their resistance line, the NYA index is still below its resistance. Is there a problem with that? There may be because…

Elliott Wave Pattern: Double Three (WXY) Structure
Double three is the most important pattern in New Elliott Wave theory and probably the most common pattern in the market these days, also known as 7 swing structure. It's…

GBPJPY Short-Term Elliott Wave Analysis - March 24, 2015
Preferred Elliott Wave view suggests pair formed a secondary peak @ 181.03 and bounces are now expected to hold below this high for continuation lower. Decline from 181.03 peak is…

Nikkei NI225 Short-Term Elliott Wave Analysis - March 24, 2015
NIKKEI 225 Japanese Stock Index cycles remain bullish. Our preferred reading of the cycles suggests a cycle from 10th March (18514) low is in its final stages and should be…

GBP/USD - Monitor The Support Area Around 1.4839
GBP/USD has thus far successfully tested the hourly support area around 1.4839 (see also the rising trendline). A decisive break of this zone of support is needed to suggest the…

Old School Currency Parables
And the LORD commanded the fish, and it vomited Jonah onto dry land. -…

Screws Tighten: ECB Forbids Greek Banks From Buying More Debt...
...ECB Exposure to Greece Tops €100 Billion; Greece Out of Cash by April 20 ECB Denies it is Blackmailing Greece Yesterday, Mario Draghi Hit Back at QE Hawks…

The Secret of Success in Mineral Exploration
As an investor, I want to bet on the jockeys who win the most races, not just the best-looking horses. So, while I'm no Tom Peters or Stephen Covey, I've…

Give'em the Old Razzle Dazzle
Janet Yellen channels Billy Flynn? Last week the Fed Chairwoman treated us to a master class of rhetorical misdirection which produced some memorable examples of doublespeak, including the soon…

Palladium Price Forecast
Let's analyse the technicals of Palladium taking a bottom up approach beginning with the weekly chart. Palladium Weekly Chart


