"No warning can save people determined to grow suddenly rich" - Lord Overstone
 |
Gold •730 days | 2,368.70 | +35.30 | +1.51% |
|
Platinum •10 mins | 1,651.90 | +23.80 | +1.46% |
|
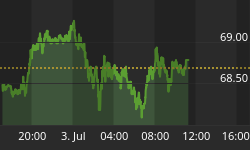
WTI Crude •16 hours | 68.78 | +0.09 | +0.13% |
|
Gasoline •16 hours | 2.953 | +0.036 | +1.23% |
|
Ethanol •730 days | 2.161 | +0.000 | +0.00% |
|
Silver •730 days | 30.82 | +1.16 | +3.92% |
 |
Silver • 730 days | 30.82 | +1.16 | +3.92% | |
|
Copper • 730 days | 4.530 | +0.111 | +2.51% | |
|
Brent Crude • 16 hours | 72.12 | +0.32 | +0.45% | |
|
Natural Gas • 16 hours | 3.245 | +0.049 | +1.53% | |
|
Heating Oil • 16 hours | 3.257 | +0.074 | +2.34% |
Article Archive | Page 1927

The State of the Trend
Most are probably familiar with the quote attributed to Einstein that insanity is doing the same thing over and over again and expecting different results. The financial version of insanity…
Bulls Continue to Rush In - Again
The perpetual reckless experiment of massive government intervention has recently launched the Dow…
Q4 2012 Flow of Funds
For years, I would anxiously await the opportunity to sift through each new voluminous quarterly Z.1 "flow of funds" report. On a quarterly basis, the Federal Reserve's Credit data illuminated…
What We Have Here is an Attempt to Communicate
The following is part of Pivotal Events that was published for our subscribers February 28, 2013. Signs of the Times "Gold Goes Into a Death Cross" -…
Market Outlook For The Week Ending March 8, 2013
For the week ending March 8, 2013, the SPX was up 2.2%, the Russell small caps were up 3.0% and the COMP was up 2.4%. All indices which had triggered…
Spoiling the 'Great Employment News'
This article originally appeared on MarketWatch under the title Jobs numbers are far worse than they look. I selected my title from a humorous comment on MarketWatch by reader…
The Coming Crash in the Bond Market
It is my contention that the 70-year debt supercycle has come to an end. To put the current financial situation in perspective, here's a long-term history of the debt-to-GDP ratio,…
Joe and Suzie on Gold's Terms
As a general rule, the most successful man in life is the man who has the best information The Dow on Gold's terms: During January 2000 gold traded at…
Contrary Gold Futures 2
Gold's technical breakdown suffered in its recent capitulation selloff naturally unleashed a flood of bearish sentiment. Traders are totally convinced gold's woes are just starting, that the worst is yet…
Be Ready the Next Time Institutional Investors Do This...
Institutional Investor Accumulation/Distribution Levels Below are the Institutional Investor levels and trending for Accumulation/Distribution since last November. The chart show's short term good news and medium term bad news. How…


