"No warning can save people determined to grow suddenly rich" - Lord Overstone
 |
Gold •734 days | 2,368.70 | +35.30 | +1.51% |
 |
Platinum •15 mins | 1,644.40 | -18.60 | -1.12% |
|
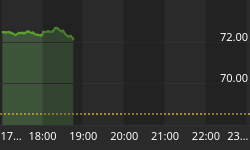
WTI Crude •11 mins | 72.41 | +1.97 | +2.80% |
|
Gasoline •13 mins | 3.011 | +0.057 | +1.92% |
|
Ethanol •734 days | 2.161 | +0.000 | +0.00% |
|
Silver •734 days | 30.82 | +1.16 | +3.92% |
 |
Silver • 734 days | 30.82 | +1.16 | +3.92% | |
|
Copper • 734 days | 4.530 | +0.111 | +2.51% | |
|
Brent Crude • 2 hours | 74.16 | +2.17 | +3.01% | |
|
Natural Gas • 13 mins | 3.276 | +0.011 | +0.34% | |
|
Heating Oil • 11 mins | 3.386 | +0.084 | +2.54% |
Article Archive | Page 794

Currency Wars: Riksbank Rattles Markets With Rate Cut Deeper Negative; Treasuries and Gold Soar, Societe Generale Drops 13%, Deutsche Bank 7%
Sweden's Central Bank, the Riksbank, rattled markets with a rate cut of .15%, now at -0.50%. Bank shares plunged again. Société Générale is down 13%, Deutsche Bank 7%, and Santander…
Gold - Breaking 1200 Dollars
Gold's strong bullish momentum is consolidating. Hourly support is given at 1046 (03/12/2015 low) and hourly resistance at 1191 (15/10/2015 high) has been broken. Expected to show a deeper upside…
Prospects for Precious Metals
On the heels of last weeks sharp recovery, the Japanese yen has continued to climb out of the broad base carved over the past year, making fresh 14 month highs…
Market Sells Yellen's 'Deer in Headlights' Congressional Testimony
Saxo Bank CIO and chief economist Steen Jakobsen phrased Fed Chair Janet Yellen's testimony before Congress this way: "The politicians were rude and pretty much clueless ... and Yellen often…
Felix Zulauf talks Financial Repressionand Warns of What is Ahead
FRA Co-founder Gordon T. Long recently interviews Felix Zulauf, Founder and President at Zulauf Asset Management AG. Felix Zulauf has worked in the financial markets and asset management for almost…
Will Dividend Stocks Save You In A Bear Market?
Myth Busters - Dividend Stocks Are Safe In recent years, many investors have been attracted…
Through the Looking Glass on Rates
On January 29th, Japan's central bank governor, Haruhiko Kuroda, announced that the Bank of Japan would introduce a Negative Interest Rate Policy, or NIRP, on bank reserve deposits held in…
Is There Gold In Them Thar Vaults?
Originally posted at Financial Survival Network David Jensen, noted metals expert and commentator has doubts about the gold being at the LBMA and the Comex. We've all…
Inflation Expectations Plunge: What, Me Worry?
Fed chair Janet Yellen keeps repeating the mantra "inflation expectations are well anchored". They're not, and I can prove it with a pair of chart on 5-year and 10-year "breakeven"…
Why the VIX is Important to Follow ...
The VIX is derived from the S&P 500 options for the next 30 days. So, it is a representation of the market expectations during the next 30 day period. Note…


