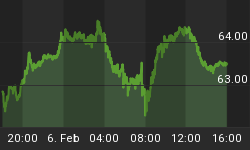
LET'S LOOK AT THE S&P 500 DAILY CHART

For the past two months I have indicated if this move up was an intermediate term counter trend up in an on going bear campaign the index you go up into this time window and trend down. The trend up since the "false break" low has been weak and that was a requirement for the counter trend scenario to be valid. It is struggling at the "obvious" resistance and that is not a confirmation since that is normal no matter which direction the trend. So the probability still exists but there is no confirmation yet. If the index could move past this time window it would indicate this is not an ongoing bear trend. But the "TIME" is now through the 2nd of May for the index to resume the bear campaign if the trend is down.
NOW LET'S TAKE A QUICK LOOK AT THE FTSE 100

Assuming if the US indexes rolls over the other stock major stock indexes will do the same. The move down in the FTSE from the February high was 13 trading days into a higher low and it is now twice that time to move back to the high level. The trend has been struggling the past three weeks but is doing so against an obvious resistance so doesn't prove anything yet, but could be vulnerable to a fall with the US Indexes.
NOW LET'S TAKE A QUICK LOOK AT THE DAX

Previously I had forecast this index would need another lower low to set in a low due to the strength of the down trend and the weakness of the rallies. You can see how the last 5 day move down went well below the last high. This two day move down held that level and could allow for further rally but the trend is still strongly down and could fall with the US index or without it. The weakness of the rallies makes this vulnerable.
US DOLLAR INDEX

Last few weeks I have been highlighting the "pattern of trend" or struggling trend down in the US Dollar Index indicating there was a possibility for a fast move depending upon how the index resolved the struggling move down. If this pattern were present in a stock, commodity or other indexes it would be an extremely high probability for low but currencies can show this pattern and break down so there needs to be some evidence a low is in place and that appears to have occurred. This possible low was sparked by a little "false break" pattern, unusual for this style of struggling pattern but is here. Minimum move up should be 73.75. Then next resistance 74.8 and if it can move past 75 (very difficult resistance) then 76 to 76.80 for maximum move up.


