


CNBC EUROPE
LET'S LOOK AT THE S&P 500 DAILY CHART

We've been looking at this chart for months with the anticipation of it running up into the zone of price and time that represented a counter trend in a bear trend. The index ran exactly into the end of the window and now there needs to be evidence of trending down and that hasn't occurred, at least not yet. A move above this resistance would indicate this is not a bear trend but a pattern of trending similar to 1948, 1968 or 1978. Now there are two days up and a swing down below the last low could set up an indication of trending down.
NOW LET'S TAKE A QUICK LOOK AT THE NASDAQ

If you'll recall the March low was a struggle down and I indicated this would be the stronger index due to the nature of the low. But you can see the index has been in a strong trend up with a 6 day move down that was retraced in only 3 days and now two corrections that have stayed on top of the previous swings. The low before the last high I've labeled LBH is always an important resistance but unless there is a significant failure the next two days there is no evidence of a top. The MIDCAP 400 even looks stronger and could be exhausting. Not all the US indexes are struggling and the question is becoming will these indexes exhaust into highs or will the S&P 500 play catch up.
NOW LET'S TAKE A QUICK LOOK AT THE DAX INDEX

In April, due to the large decline and the nature of the downtrend I though the index would run to a marginal new low below the March low after this rally was complete at a price level at or below the February highs. How an index behaves around an "obvious" support or resistance level can be very insightful. When the index came up to the April high it fell two days, remember the normal counter trend against a trend is 1 to 4 days, and in one day was at a new swing high. The next move down was a very small two days that held the previous high showing support at a very high level. And now as it approaches the "obvious" there is a tight consolidation on top of the last high. That is not a bearish picture and could spike up. The volume is not bullish and has been drying up and if this current rally can fail today or tomorrow and break the low of the 9th in one or two days it will look like it is trending down with a counter trend up in place. But when markets consolidate below the "obvious" it does offer a probability to spike up through that resistance, the next two days should tell that story. The two day rally if it fails now, breaks the low of this little sideways move and exceeds four days or shows "follow through" after the break will look like a counter trend rally while trending down.
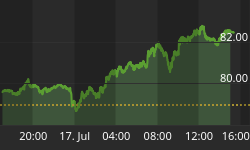
NOW LET'S LOOK AT THE FTSE

The FTSE showed a higher low VS March and therefore has shown a stronger rally. When it approached the "obvious" resistance it showed a "normal counter trend down of 3 days, then two day down and less in price followed by the last spike up and now, so far, 3 days down. If a high is in, it will need to exceed the largest move down while trending up or 5 days in time and 216 points. If that occurs then we'll look for the next rally to set up as a "normal counter trend" up of 1 to 4 days just as the moves down set up as counter trends down.
But none of these indexes have given a sign of ending the up trends yet. Quite honestly I am getting a little nervous about looking for evidence of trending down when they could just as easily spike up.


