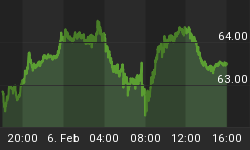
Gold and silver gave traders a shock on Friday in reversing sharply below nearby pivotal support at $380. It was a classic "run" on the stops at the COMEX as first one then another pivotal level was taken out like a hot knife slicing through butter. This leaves gold investors asking, "Is this the start of a major crash?" and "Where will gold find support?" These are critical questions that I feel obliged to try to provide an answer.
December Gold on the COMEX closed precisely at $370 on Friday, Oct. 3, in a session that saw the yellow metal down $13.70 during the trading day. In gold's weekly chart, this is roughly where the 10-week moving average intersects. The $370 level is also a pivotal in the daily chart, as you can see below.

Given the sharp downside penetration on Friday there is a possibility of further weakness early next week, so we should be prepared for this. Here is where the weekly gold charts comes into play. You can see this $360 level in the weekly chart posted here, which shows that $360 is where the lower boundary of the 6-month uptrend channel intersects. I'd even give gold a little more leeway down to the $350 level before finally giving up on it since this is where the parabolic bowl in the monthly chart intersects. So I'd call $350-$360 gold's critical band of support, with the $370 level (Friday's closing value) acting as immediate-term support for now.

Now that gold is beneath the 2-month uptrend line in the daily chart it means we have a new set of upside parameters to start watching. Gold's first overhead resistance will come in at $380, where the 20-day moving average intersects in the daily chart. But the most important resistance is at $385, where the 2-month uptrend line crosses a minor downtrend line to form a criss-crossing resistance pivot. You can see this in the chart above. Gold must close above $385 in order to get back above the trendline. Until then, we must treat the short-term trend as being down.
December Silver suffered an equally sharp downside move on Friday, closing down nearly $0.27 to finish the week at $4.83. Since silver broke beneath its $4.90 pivot, this is short-term bearish, but silver will have an opportunity at finding support next week when trading resumes at or above the $4.70 level. Again, you can see the significance of this level in the latest silver daily chart posted below. It is at $4.70 that a long downtrend line extending from the August highs intersects.

Our update wouldn't be complete without mentioning the U.S. Dollar index, which has been crucial of late. You can see the latest chart of the dollar here, and despite the upside move on Friday it is still beneath its falling trend channel. It would take a decisive breakout and close above the pivotal $94 level for the dollar to send a truly bullish signal. The dollar last traded at $93.53.

The dollar has come under the scrutiny of the world's financial press of late, which in itself is significant. Looking back through the past two weeks of the London Financial Times newspaper, I counted several dollar-related headlines, including an FT editorial dedicated to the recent dollar woes. Among them: "A plunging dollar needs handling with care," "Dollar doldrums," "Signs indicate a downward path," and "Dollar could plumb new lows, say forex traders."
Then there was the September issue of Futures magazine with a depiction of a battered and bruised George Washington on the front of the U.S. $1 dollar bill with the headline, "Will the dollar fight back or take a dive?" Essentially, Friday's dollar rally and corresponding gold/silver plunge was a function of way too much bearish investor sentiment on the dollar. Short interest has been allowed to pile up to unsustainable levels recently and I believe that the action we are witnessing is mainly a function of short-covering (in the dollar) and profit-taking in gold. It didn't help that the Financial Times ran a feature article in yesterday's paper entitled "Precious metals add sparkle to portfolios: With a falling greenback, commodities are a good way to diversify." This wholesale advertisement of gold to the investing public practically guaranteed that gold would experience a sharp pullback (although this pullback was a lot sharper than I would have envisioned).
The sharp "pullback" or whatever you want to call it will likely serve its purpose of shaking out the weak hands, scaring away the public from getting involved in precious metals, and also of allowing the strong hands to accumulate more gold at lower levels. A sharp pullback such as occurred on Friday is the true test of a commodity's strength, because any commodity currently in the hands of the "smart money" traders will not break the dominant upward trend on a pullback; rather, it will only serve as a temporary pause before the uptrend is resumed. Gold's big test will come next week and the truth of gold's strength will be seen if it can maintain above the $350-$360 critical support area. If it does, it will have passed the test with flying colors and will soon be on its way up to test the recent highs.
Personally, I plan on using this latest pullback as an opportunity to add to my portfolio of gold bullion and numismatic coins. I was holding off from making any additions until Friday's sharp downside move occurred, but now I have a reason to start loading up again. I can't be the only one thinking along these lines and there must surely be others who will view this gold market correction as an excellent opportunity to "buy the dips." If you currently hold the physical metal as part of your investment portfolio I suggest you might want to do the same.


