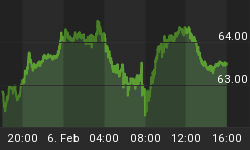
The Treasury market was essentially unchanged last week. As discussed in last week's edition, ongoing weakness in the real economy and renewed turmoil in the stock market are providing solid support for bonds. The event that got the most visible market reaction last week was the release of the FOMC meeting minutes. The Fed reduced economic growth forecasts for 2008 by about 1% from 1.7 to 0.7%. They kept dreaming about 2.5% growth in 2009. As previously mentioned the market does not yet believe that sluggish or no growth will persist, so the Fed downgrade came as a surprise and severely dampened enthusiasm for the stock market while boosting the appeal of Treasury bonds. Our readers who bought bonds and sold stocks on our recommendation from 2 weeks ago were feeling pretty warm and fuzzy. That trade has a bit more upside left, so do not abandon that ship just as yet.
One topic that has been discussed with increasing regularity by bond market participants is the accuracy of the inflation data in the United States. How in the world is it possible for the US to have a core inflation rate around 2% - and headline inflation around 4% - while a country like China, whose currency has appreciated 7-8% per year versus the US Dollar, has an inflation rate well north of 8%? China is only one of dozens of countries that has substantially higher inflation and an appreciating currency relative to the US. The essential question is: does it really matter though? Treasury bond yields out to 10 years are negative even with the incredibly "rigged" US data. Also, in this information age are there any self-respecting bond traders or fixed income portfolio managers who are not aware of the hedonic quality adjustments to CPI or the way the housing component is manipulated through "owner's equivalent rent"? I will give lots of credit to the bond crowd and stipulate that they are aware of the above outlined issues. So a, how much is US inflation understated by, which begs the question b, how negative are Treasury bond yields in reality and c, how could the bond vigilantes let this happen? My answer to a, (and at the same time b) is that calculating inflation is more of an art than a science, so while there is no black and white answers, even if we just take the pre-1990 way of measuring CPI, it would put inflation north of 7%, which at least would be in line with inflation rates in developing countries (without currency value adjustments). Some folks would argue that those numbers are low-balling reality. So that would put Fed Funds at a negative real rate of larger than 5% and long bond yield real rate of approximately 3%, with the rest of the curve somewhere in between those figures. That gets us to c, if all this info is out there, how can Treasury yields be so low? The answer is shockingly simple, the bond market is telling us that the situation out there is soooooo desperate that the Fed needs to have the curve anchored at a larger than -5% real rate in order to provide enough stimulus to keep not only the real economy but also the financial system from capsizing. Only time will tell if -5% will do the job, but my bet is that it will NOT get GDP growth to 2.5% in 2009.
NOTEWORTHY: The economic data calendar was light last week. A rising stock market helped Leading Economic Indicators show a "massive" 0.1% increase for the second month running. PPI curiously only increased 0.2% on the headline figure but it was up 0.4% on the core component. Chalk another one up to "seasonal adjustments". Weekly Jobless Claims decreased 9k to 365k last week. Existing Home Sales "only" declined 1%, but the inventory of unsold homes rose to 11.2 months and prices declined 8% year over year. Not much to chear about in my humble opinion. Next week's headliners will include Consumer Confidence surveys along with New Home Sales, Personal Income and Spending.
INFLUENCES: Trader surveys have trended down for the past month and remain in neutral territory on bonds during the latest week. The Commitment of Traders reports have indicated that the commercials have a long bias in their positioning. Last week's data showed that Commercial traders were net long 182k 10 year Treasury Note futures equivalents - a decrease of 60k. The COT data is neutral with a slight positive bias. Seasonals are positive. The 10 year yield remains below support in the 3.9 to 4% area for now. The positive factors are dominant, so I expect a bullish bias to persist here.
RATES: The US Long Bond future traded up 1/8 to close at 116-19, while the yield on the US 10-year note decreased 1 basis point to 3.84%. The yield curve was flatter but I am expecting that the curve will retain a steepening bias. Long-short accounts can take advantage of the steepening trend by buying 2 year Treasuries against selling 10 year Treasuries on a risk weighted basis using cash or futures. This spread was unchanged at 141 during the past week. It looks like the curve steepener has run into solid resistance at the 200 level. This may take months to overcome. In the mean time the range is expected to be 140 to 200.
CORPORATES: Corporate bonds remain overvalued, especially the weaker credits.
BOTTOM LINE: Bond yields were unchanged last week. The fundamental backdrop remains bleak in spite of increasing inflationary pressures. Trader sentiment and COT positions are neutral, while the technical setup and seasonal influences are supportive. My recommendation is to add to the curve steepener, continue to shun the weaker corporate credits. My bias remains bullish across the yield curve until 4% is convincingly breached on the 10 Year Treasury Note.


