


Market Wrap
Week Ending 6/27/08
Stocks
It was a tough week for stocks, as a new leg down of the bear market got underway. The Dow broke below its March lows and appears ready to test its July 2007 lows.
The best strategy is to either be out of the market and watching from the sidelines, or to be playing the move down via a fund such as Rydex Ursa, which is inversely correlated to the S&P 500.
Up first, is the daily chart for the Dow Jones Industrial Average. The chart shows the break below its previous low for the year, and the next possible level of support.
Notice that volume has expanded during the recent move down. This suggests that more downside action can be expected. The market is, however, becoming oversold.
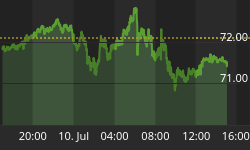
The second chart is the Rydex Ursa fund, which is one way to play the weakness in stocks, as it is an inverse fund that goes up if the S&P goes down and vice versa.


A great deal of the money and credit needed to fuel the present global boom & bust cycle results from the yen carry trade, where players borrowed the yen short and invested long, pocketing the difference in the "spread".
Whenever risk aversion grows strong, carry trades get unwound and stock markets go down. Whenever risk is embraced - carry trades increase and stock markets rise.

During the last two weeks, I was fortunate to start accumulating positions in the Japanese Yen Trust above.
Since that time it, has risen above its falling trend line, while the U.S. stock market took another hit to the downside.
This is another vehicle to play the downside of the bear market with, as they are inversely correlated. Also, the yen tends to trend in the same direction as the gold market.
Bond & Rates
Since April of this year interest rates have been on the rise, in late May they broke above significant horizontal resistance just above 39. They moved to a high of over 43 and are falling back towards the 39 level.
Will 39 hold as support, or will interest rates bounce off of it and begin to rise again, signaling that higher rates are coming?
If I had to guess, I would say the Fed wants lower rates, but that they may get higher rates, at least on the long end of the curve - the Fed can only affect the short end of the curve.
The short end may hold steady or vacillate back and forth while the long end sees higher rates - thus increasing the slope of the yield curve, which the banks need right now as they are approaching their weakest hour.

Commodities
Commodities keep rising in an almost relentless fashion as the chart below shows.
Some commodities are overbought, such as oil and agricultures, while others have already pulled back and are nearing buy zones: pot, fcx, mon, pcu and others.
Up first is the weekly chart of the CCI, which gives a true picture of the overall commodity markets, as all commodities are equally weighted, as compared to the CRB index that has different weightings.

Both DBA and POT have been strong performers of late and I have been fortunate to hold them in my portfolio.
I will be looking to add positions on pullbacks that hold support lines. Both companies are involved in food - a very strong market sector right now.
DBA

POTASH CORP

I am looking to re-establish positions near the horizontal support line if support holds on a retest.
Gold
Gold had a strong week, rising 27.60 (+3.05%) to close at $931.30 (continuous contract). Below is the daily chart for GLD. It shows nearly the same gain for the week. However, there is a huge upside gap lurking right beneath the recent move up. Gaps love to fill, but they don't have to; the question is when and from what level if they so decide.
Price has blown above its downward sloping trend line and is now approaching horizontal resistance just above 92. If gold can break above 92 and resistance turns to support, there is a good shot at filling the gap left back at 96 in March of this year.
If price cannot get through 92 it will most likely drop to retest its lower trend line. If the lower trend line doesn't hold, a retest of the May low might occur. RSI sports a slight divergence making a new high while price did not.

Silver
Silver had a good week as well, rallying up 0.31 to close at 17.71 for a +1.80% weekly gain. The daily chart below for SLV shows price breaking above its upper trend line and now headed up to test horizontal resistance at 180.
RSI has turned up and MACD and the histograms are just starting to enter positive territory. The biggest question on the chart is: will the gaps need to be filled, and if so - when?

GDX Index
The GDX had a strong week, gaining over 10% to close at 48.29 - a good showing.
The daily chart below shows a negative RSI divergence, which made a new high, while price did not.
RSI and histograms have both turned up nicely. Two large gaps remain to the recent rise, will they be filled or not? Significant overhead resistance is found at the 50 level.

Volume expanded on the rally, which is a constructive development.
Goldcorp
Goldcorp is one of my favorite gold stocks. I have owned it numerous times during the bull market and it has always been good to me. Last week I sold my position that I had bought the week before, as I had the prior week.
The profits came quick and easily so I decided to book them. I still like the stock, and plan on buying more on any pullback that holds support. Goldcorp is arguable one of the best gold stocks out there.
It looks like Goldcorp is finishing off the last touches to an inverse head and shoulders formation - all that remains is a strong expansion in volume indicating the move has staying power behind it. Volume finally began to expand the last two days.

GOLD
Randgold I was lucky to buy early in the week at 40, and sell it on Friday for over 46, which was good enough for me to book for a few days time.
The chart below shows RSI forming a negative divergence, and a couple of gaps looming below the recent rise.
MACD has put in a positive cross over and the histograms are moving up strongly. Volume expanded on the rally, which is constructive. I will look to re-enter upon a correction that holds support.

CEF
The Central Fund of Canada is one of my favorite investments in the present market environment. There is a lot of risk in all markets right now, especially in paper markets.
Any market or asset - even those that claim to be gold or silver investments, if they don't hold 100% of the precious metals on reserve, they are mere paper shades of what they promise (same as our money).
CEF holds all reserves in physical gold and silver. It is safe and sound. In times of unchartered waters, a little cove can come in handy.

The chart shows CEF about to make a positive MACD cross over, as the histograms are receding to zero. RSI has turned up. Horizontal resistance is being tested as we speak.
Cameco Corp.
Cameco is the largest producer of uranium. More and more nuclear reactors are coming on line. They require uranium. Cameco has lots of it.
The chart below shows the 50 day moving average broken above last week, the downward sloping upper trend line was also broken above, and on Friday horizontal resistance just above 40 was taken out.
RSI has turned up from below 50 to 58 and headed up. MACD has made a positive cross over and the histograms have entered positive territory as well. All the indicators on the chart appear to be lining up in sync.

Good luck. Good trading. Good health, and that's a wrap.

Come visit our website: Honest Money Gold & Silver Report
New Book Now Available - Honest Money


