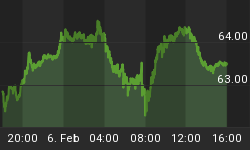
Interesting that the TLT's (Lehman 20 year T-bond ETF) fell 1.4% on Friday, which reflects a climb in 10-year T-note yields to 3.94% from 3.83% earlier on Friday. Yet the stock indices continued to undergo waves of intense long liquidation. My guess: that the reversal in the TLTs -- normally an instrument that attracts buyers during times of financial panic and flight to safety -- is hinting that the current phase of the plunge in stocks is nearing completion. The problem is that it could last into Monday or Tuesday, so no sense in standing in front of this falling sword.
While we have reasons to expect an upside reversal in equities, looking at the daily S&P 500 chart we see that until the SPX can sustain a rally that hurdles a prior rally peak, all bets are off. Entering Mondays trading, the climb above 1258 is to get initial traction on the long side, while a climb that sustains above 1278 is needed to confirm a meaningful, tradable low.

It's possible that although the vast majority of the time when Treasury prices decline money shifts into equities, perhaps this time is different. Maybe longer-term Treasuries are being sold down hard because global investors are concerned that the dollar is about to really implode -- and could go into a free-fall type of move. Certainly, fear of such a prospect would prompt big holders of dollars to unload the currency -- and dollar-denominated assets.
Or perhaps we have finally reached that part of the disaster scenario when foreign governments start to bail out of some of their substantial holdings of US Treasury paper. No wonder gold prices are rallying... and could just be starting a move that mirrors a plunge in the dollar.
Whatever is causing the rally in gold, my near and intermediate term pattern and momentum work looking at the daily spot gold chart indicates that the budding upside breakout in spot gold is heading for an initial target of $965 on the way to $1002 thereafter. Any pullback should find very substantial support at $944-$939 prior to another upleg.

The other surging commodity, of course, is oil. Looking at the daily chart of the nearest futures contract on crude oil, until Thursday at about 2:30 pm Eastern, the developing near-term pattern in crude oil exhibited potentially corrective form -- a tight, 3-session consolidation at the low end of a decline from $145.85 to $135.14.
However, once the rally within the coil climbed above $139, all heck broke loose, and continued on Friday into new all-time high territory near $147 (the chart, which goes only through Fri am, shows a high of $145.98). At this point I have to believe that nearby oil ended a correction at $135.14 on Tuesday and has started a new upleg that projects to $147-$149, and then possibly to $155-$160.
Only a decline that breaks below $141 will begin to compromise the current upmove.


