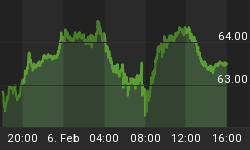
Today's charts show the inflows and outflows of liquidity into the stock market. When inflows are trending up and positive (in expansion), the competition for stocks becomes high and prices are bid up causing an upside rally.
The opposite happens when we see liquidity outflows and a trending down pattern. When this is happening with outflows in contraction territory, the balance shifts to a selling competition where investors try to get the best price before expectations of lower movement. This causes a condition that ends up in a market correction.
At the end of May, Liquidity inflows started to decelerate when the April/May liquidity up trend had its support line broken to the downside. Liquidity has been in contraction ever since.
What has happened to liquidity inflows and outflows during the past few weeks?
If you look at the circled area on the chart, you will find the action since Mid-July. In the circled area, you will see that the liquidity has remained in contraction territory with a rise ... followed by a higher/low ... followed by a lower high and then by a higher/low yesterday.
That action was setting up the possibility of a triangular pattern at the close yesterday. See the second chart for what was happening at the open this morning.

At 9:37 AM this morning, the Liquidity did bounce from the support confirming a triangular formation.
Triangular formations are a "squeezing formation" because the resistance line drops lower, and the support line rises higher. This squeeze is typically exhibited by higher intra-day volatility in the stock market until a break out of the squeeze occurs.
As an investor, that is what you are waiting for now. An upside breakout on this liquidity squeeze would feed an upside stock market movement as investors bid prices higher. A downside breakout on this liquidity squeeze would cause underbidding by investors as they try to sell holdings.
It is data like this that helps investors "understand what is making the market behave the way it does". Today chart is posted as a courtesy, and can be found every day on our paid subscriber sites.


