


The market was somewhat positive during the week but that impression seems to fall apart when one takes a good look at the daily figures. Two days on the down side. Two days where gold closed lower than where it opened. Only one day where gold closed higher from the open AND previous close.
GOLD
LONG TERM
The long term prognosis has not changed with the really minor activity of the past week. The long term P&F chart has not moved and the indicators continue where they were last week. No use in wasting time, the long term rating remains BEARISH.
INTERMEDIATE TERM
Nothing much has changed on the intermediate term either. Gold remains below its negative sloping moving average line and the momentum indicator continues to drift sideways inside its negative zone. The momentum is, however, above its positive sloping trigger line. The volume indicator has not been acting very positively lately and remains below its negative trigger line. All in all, the intermediate term rating remains BEARISH.
SHORT TERM

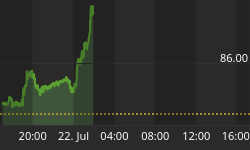
Last Friday we had what looked like a reversal day, to be confirmed on the next day. Well, that confirmation did not come. We have another such candlestick this Friday. In the mean time things have been firming up a bit but the developing pattern does not give one much confidence that the up side will last much longer. These upward sloping wedge patterns are usually bearish continuation patterns when developed after a downside move. Look for a break-out on the down side.
Looking at the normal charts to see where the gold price stands at this time, short term wise, we have the price above its short term positive sloping moving average line. In addition, we have the very short term moving average now above the short term line for a positive indication of existing trend. The short term momentum indicator continues to move in a basic sideways direction in its negative zone but still above its positive trigger line. The short term rating has now moved up into a full BULLISH rating, however, this is short term and can change quickly. That wedge pattern is not encouraging.
As for the immediate direction of least resistance, the Stochastic Oscillator had peaked and reacted. It is showing weakness but is still in its positive zone. The price is just a knotch above its very short term positive moving average line and above the short term up trend line. If it wasn't for that bearish wedge pattern I would say that upside was the path of least resistance. I still have to say so BUT with a serious eye on the $825 level for a downside break.
SILVER
Like gold, silver had rallied up to its resistance level from previous activity and stalled. Unless silver closes above the $14.25, level it looks like the downside is more probable as the direction over the next week or so.
U.S. Dollar Index

Since the U.S. Dollar Index and gold price seem to be linked so often, in opposite directions, I thought I'd show the Dollar Index again in P&F format. Over the past few years it had rallied then continued its long decline from several years back. Once more it seems to be rallying while gold seemed to be dragged lower. On this chart the U.S. Dollar Index has met its major projections, although much lower ones can be calculated. The rally so far has broken above a secondary trend line but not quite the primary one. A move to $77.50 would do it. Then one can say with greater conviction that the Dollar is heading towards its present $83.50 projection. This would have negative impact on the gold price which would be expected to move still lower.
MERV'S PRECIOUS METALS INDICES TABLE

It's a long weekend and somewhat of a lazy week-end. I think I will cut the commentary short this week and have a fuller commentary next week.


