GOLD

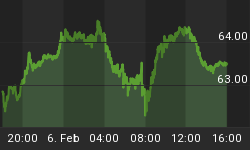
The support zone at $775 did what was expected and held firm, which allowed for a bounce in Gold. This bounce has entered a critical stage now by moving near the resistance at $850.
Although Gold is back above the 14 d. MA we have to be prepared for a disappointment and see it come down again. The resistance could prove to be much too strong to break. If the resistance stops this current bounce it will be just a matter of time before the support zone at $775 is targeted once again.
The RSI is still in negative territory and seems to be rolling over. It has to break above the 50 level to get some positive sentiment going. The Buying Power still has a long way to go before a buy signal will appear. The only positive note at this time is the rising MACD, but it is still in negative trend territory, indicating that this current move is just a correction in a downtrend and nothing more.
SILVER

Just like Gold, Silver is running into a heavy resistance zone formed by the $14 level and the 14 d. MA.
The recovery from the $12 support seems to be corrective. There's no real impulsive move visible which makes this bounce very dangerous. It could end suddenly and the previously fierce decline could resume. The only thing that could help avoid this expectation would be a clear break above the 14 d. MA and the resistance at the $14 level.
The needed break will be difficult to realize because the indicators aren't in very good shape:
-
The RSI has only barely risen above oversold levels and could roll back into them
-
The Buying Power is still far from a buy signal
-
The MACD has produced a tiny buy signal but is down in negative trend territory
All in all it seems that the best we can hope for now is some sort of bottoming process at the current level to allow Silver to build some internal strength for a new rise.
OIL

The expectations for Oil that we mentioned last month proved to be right, at least for the time being. The magenta line and the support at $110 stopped the correction and the bounce took Oil back towards the resistance at $120.
For now the chart seems to be building some strength and as long as Oil can stay above the 14 d. MA this process can continue. Should the current levels be defended successfully the chances are rising that the definite bottom for this correction has been set and a new, higher wave will follow.
The RSI is still in negative trend territory, but is just shy of a break above the magenta line. If it breaks above the 50 level again positive sentiment will get a good boost.
The Buying Power is fighting for control. We have to wait and see if it will succeed.
The MACD is rising at a firm pace, although it still has a long way to go before positive trend territory is reached.
USD

The dollar has shown more strength then expected. The first decline was stopped short by the rising 14 d. MA and the dollar was pushed higher again, back to the resistance level around 78.
The above chart shows that the 14 d. MA is acting as a good support, and as long as this continues it will eventually push the dollar through the resistance around 78. The flipside is that should the dollar fall below the 14 d. MA, a bigger correction might follow, stopping first to the magenta line, then the blue zone, and perhaps as far down as the 73-74 level.
There are some slightly negative implications showing up in the chart, including possible negative divergences in the RSI, Buying Power and MACD. These could still be averted, but it can't hurt to take good notice of them to stay cautious.
COPPER

The chart for Copper turned bad when it dropped through the very important resistance zone at $350. This zone should have supported the correction but it failed, and so the chart produced a very big sell signal.
Last month Copper even completed a back test of this resistance level, triggering another negative signal. Chances are very slim at this point that a break back above this level will happen before the more likely fall back to the $320 level.
The expectation of a fall to $320 is supported by the current movements in the RSI (bouncing off the 50 level), DMI (Selling Power gaining momentum) and MACD (rolling over).
The above is an excerpt from the technical analysis portion of the monthly Resource Fortunes Premium Newsletter publication, available in its entirety for subscribers at http://www.resourcefortunes.com/. We currently offer a 30-day trial subscription for $2.99.


