


Overview
Actual losses in the US real estate market are much higher than what you have been reading in the newspapers recently. Using a combination of official government statistics and the most widely used index of housing values, we will demonstrate that the US real estate market has lost a total of $6 trillion in value in the last two years. We will show that an average house that was worth about $226,000 in 2006 is, once you adjust for inflation, down to a real value of only about $160,000. To put what a $6 trillion loss is into perspective, we will show that when all factors are taken into account, the two year drop in US real estate values is equivalent to wiping out the entire retirement savings of all 78 million Baby Boomers, and annual housing losses are close to the annual GDP of China. We will close by talking about how this national disaster creates major personal profit opportunities for people who can learn to look beyond the false number of nominal dollars and into the reality of how wealth is rapidly redistributed during times of economic turmoil.
Four Steps To Finding Total Real Estate Losses
To understand the full extent of US real estate value losses requires a four step process: 1) Find the average loss in dollar terms for single family homes; 2) Find the decline in the value of a dollar during the same period; 3) Combine the fall in housing values with the fall in the value of the dollar to find the real housing loss, not in dollars, but in purchasing power, or what a dollar will buy for you; and 4) Determine the loss for the US economy as a whole.
Step 1: Average Loss Per Home (Simple Dollars)
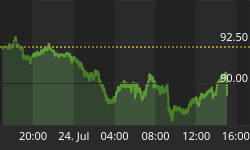
The widely quoted S&P/Case-Shiller Home Price Index reached its maximum value during the month of June, 2006 at a level of 226.29 (10- City Composite). Two years later, by June of 2008, the index had reached a level of 180.38. The fall of 45.91 in index value means a 20.29% decline in the average value of a home in the cities measured. This decline is illustrated in the graph below:

Step 2: Decline In The Value Of A Dollar
The most common measure of the decline in the value of a dollar is the Consumer Price Index (CPI). Unfortunately, it is growing increasingly difficult to find consumers who believe the CPI accurately reflects the prices they are paying in such crucial areas as energy, food or medical care. (This disbelief is particularly strong among those living on a fixed income.) Indeed, when inflation is measured using the same statistical methods of past decades, it is above 10%, according to John Williams of Shadowstats.com.
Therefore, for this analysis, we will compromise between the official rate of inflation, and a widespread belief in higher actual rates of inflation, by using a different official government inflation index, that of the Producer Price Index (PPI), which measures wholesale inflation. (To the extent that wholesale inflation tends to lead retail inflation, the two indexes should be converging anyway before too long.) The Producer Price Index in June of 2008 set a 27 year record with a 9.2% twelve month rate of inflation. The last time inflation was this high was the same year that Treasury yields exceeded 15%, and 30 year mortgage rates exceeded 16%. We are in the midst of an extraordinarily rapid destruction of the value of a dollar.
This is shown in the graph below, which illustrates monthly changes in the value of a dollar over the last two years, based upon monthly changes in the PPI. As shown, by June of 2008, a dollar would only buy what 88.7 cents would have purchased in 2006.

Step 3: Adjust Housing Decline For Loss In Value Of Dollar
There is a basic problem with the 20% decline in the dollar value of single family homes over the last two years, and that is that those dollars themselves are worth less than they were two years ago. So, if we want to look at the real value of homes, then we need to adjust our home values for inflation. For dollars themselves aren't what matter - it is what you can buy with those dollars. The chart below shows what happens when we combine the 20% decline in the real estate index with the 11% decline in the value of the dollar.

As you can see by following the June 2007 line, twelve months after the real estate peak, the index value of the average house was down 9 points, or 4.0%. However, the value of the dollar had also fallen 3.2% during that time, so that by December a dollar would only buy what 96.8 cents would have bought in June. When we combine the two, with 4% fewer dollars and each of those dollars being worth 3.2% less, then on a real (purchasing power adjusted basis) the average homeowner lost 7.0% of the value of their home during that year, as can be seen in the rightmost column. In other words, real homeowner losses were 75% greater than what was widely reported.
Click Here To Learn About A Free Mini Course That Will Teach You How To Turn Inflation Into Wealth. | |
As we go forward to December of2007, eighteen months after the peak, the decline in the value of the housing market was really starting to pick up, with a loss in the index of 26 points, or 11.3%. Unfortunately, the rate of inflation was also beginning to pick up, and the dollar had fallen 5% over the eighteen months, meaning a dollar would only buy what 95 cents did in June of 2006. So a house is worth 88.7 cents on the dollar, but the dollar itself is only worth 95 cents, and when we combine the two, the real value of the average house fell 15.7%. This was about 40% greater than what was widely reported.
By the time we reach June of 2008, then as shown above, the real estate index was down to 180.38, a full 20% decline. The dollar was down to 88.7 cents, as it had lost 11.3% of it's value. When we combine the two, we say that a average $226,290 house in 2006 only has a market value of $180,380 by June of 2008, and when we also include that a 2008 dollar is only worth 88.7 cents - then the real value of our house is not $180,380, but $159,920.
When we adjust for inflation, a house that was worth $226,000 in 2006, is down to a real value of only $160,000 in 2008.
Which means the real dollar loss is not $45,910 - but $66,250. Thus, the real percentage loss is not 20% - but 30%. The real loss in homeowner wealth has been a full 50% greater than what is being widely reported in the media.

Step Four: Add Up Losses For All US Households
How big of a blow is a 30% decline in housing values to the US economy and national wealth? For the answer to that, we will turn to the Federal Reserve. As of 2006, Federal Reserve statistics show that total household real estate assets were $19.8 trillion (Statistical release Z.1 (Flow of Funds), table B.100( Household Balance sheet), line 4). So, we start with $19.8 trillion and multiply times the 29.3% real two year decline in home values that is in the bottom right hand corner of the chart.
$20 trillion in 2006 real estate, times 30% inflation-adjusted real estate losses between 2006 and 2008, is a $6 trillion dollar loss in homeowner wealth (rounded numbers).
What is $6 trillion? Numbers that large are difficult to grasp, but 6 trillion is equal to 6 million, times 1 million. So a six trillion dollar loss is equal to six million people each having a million dollars, and each having their entire net worth wiped out. Six million millionaires, each losing every penny.
Another way of viewing $6 trillion is that as of 2006, it was equal to the sum of Baby Boomer retirement account investments, as well as pension investments dedicated to funding Boomer retirements (a detailed methodology for the $6 trillion in 2006 figure can be found in my previous research report "Adding Up $44 Trillion In Boomer Wealth Expectations"). A $6 trillion drop in value is equal to wiping out 100% of the retirement savings accounts and pension investment values for all 78 million US Baby Boomers between ages 44 and 62.
For additional perspective on the value of $6 trillion, the Chinese economy reached a GDP of $3.4 trillion in 2007, according to the Chinese news agency Xinhua. That means that over the last two years, the US housing market has been losing value at a rate almost equal to the size of the entire Chinese economy, the economic juggernaut that is currently driving much of the growth of the global economy.
(The Purchasing Power Parity (PPP) measure of the Chinese economy at $7 trillion for 2007 (as calculated in the CIA Factbook) is a much better measure than a GDP that is based upon blatantly manipulated currency values, but using such currency values as if a (non-existent) fair market had established them is the norm for financial reporting, so we'll use it here. Even if we use the PPP, the loss in wealth compared to the Chinese economy is still extraordinary.)
Yet another way of looking at the size of $6 trillion is to compare it to the source of much of the plunge in value for real estate, which is the subprime mortgage securities market. The subprime debacle, which has shaken the global financial system and ravaged four of the strongest financial institutions in the US (Fannie, Freddie, MBIA and AMBAC), took place in a $1.2 trillion market. The two year loss in US housing values is five times the size of the total subprime mortgage securities market.

As can readily be seen above, the two year collapse in US housing values is a financial disaster of epic proportions.
(Note that the $6 trillion loss shown does not reconcile with Federal Reserve real estate values for 2008, which show total real estate asset values of $19.7 trillion as of the first quarter, meaning essentially no fall in real estate values. Curiously enough, the official government statistics seem to do a remarkably good job of rising fast with rising real estate values, yet, don't seem to reflect bad news at all. Much like some of the most... interesting... inflation numbers that the government has been using lately to claim that the economy is still growing fast, as measured by the GDP. More on this subject can be found in my article "Inflation Index Manipulation: Theft By Statistics".)
Personal Implications & Taking Actions
Let's think for a moment about recent financial history. How about the collective "wisdom" of the markets pushing the NASDAQ to 5,000 - and then 80% of that value quickly imploding as the NASDQ fell to 1,000. Then there is this most recent episode, where it appears the collective brilliance of the markets ran up a little $6 trillion (and still counting) pricing mistake. Just a little rounding error, twice the size of the economy of China. Now, let's think about the safety of your retirement and other investment assets. When you direct your IRA and 401 plans, when you plan your retirement income, what is your source of safety for your stock and bond investments? In the financial profession, your ultimate source of safety is what is known as the "Efficient Market Hypothesis", which just basically says that the awesome wisdom and intelligence of the markets makes sure that all securities are always fairly priced.
Given what we've seen just in the last decade - how confident are you about this collective brilliance of the markets? Confident enough to risk every penny of your retirement savings? Yet, you must invest and invest well - or inflation will eat your savings, and you will be impoverished anyway. So, what do you do?
A place to start is to very seriously think about reducing your ownership of financial assets. If you are investing for retirement and your portfolio of stocks and bonds gets taken down by broad market developments similar to what has already happened with real estate and tech stocks just in the last seven years, then you may never have the chance to replace retirement savings. There is a powerful, powerful case for moving a substantial portion of your assets into tangible assets. Good examples of tangible assets include gold, silver, commodities, farmland and energy - and yes, real estate. Not at the peak of a bubble, but at the right time and the right price.
The next thing you should do is very seriously think about is whether crisis leads to opportunity, in ways that go well beyond a simple strategy of only buying tangible assets. As a prominent recent example, John Paulson saw the crisis that was coming in subprime mortgages, researched and educated himself on this area (which had not been his field of expertise), and he turned the crisis into a $3-$4 billion personal payday in 2007. If you're not a hedge fund manager like Paulson, you may not have the tools that he used to turn a market crisis into personal billions. That's OK, because Paulson didn't start with the tools either. He started with educating himself, learning about a new area, until he came up with a novel way to profit from disaster. A method that wasn't in the financial textbooks, and that he didn't find by reading a financial columnist in the paper.
You have more tools than you may think, some of which may surprise you. Tools which can give you the opportunity to turn financial disaster into personal net worth. There are ways you can use those tools to turn the $6 trillion fall in real estate values in combination with the destruction of the US dollar into perhaps the greatest real wealth-building opportunity of your life, on a long-term and tax-advantaged basis.
But, if you want this to happen - then education is the essential first step. You are going to have to not just understand, but to master some of the financial forces and methods in play here. You will have to learn how to turn the destruction of paper wealth into real wealth. With Turning Inflation Into Wealth being the first key step. My best wishes to you for turning this challenge into an extraordinary personal opportunity.
Do you know how to Turn Inflation Into Wealth? To position yourself so that inflation will redistribute real wealth to you, and the higher the rate of inflation - the more your after-inflation net worth grows? Do you know how to achieve these gains on a long-term and tax-advantaged basis? Do you know how to potentially triple your after-tax and after-inflation returns through Reversing The Inflation Tax? So that instead of paying real taxes on illusionary income, you are paying illusionary taxes on real increases in net worth? These are among the many topics covered in the free "Turning Inflation Into Wealth" Mini-Course. Starting simple, this course delivers a series of 10-15 minute readings, with each reading building on the knowledge and information contained in previous readings. More information on the course is available at InflationIntoWealth.com.


