


October 01, 2008
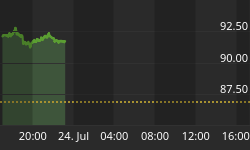
LET'S LOOK AT THE S&P 500 DAILY CHART

This is a picture of the trading since the July low. Notice during this move down how each time the index has broken below a low it has popped back above that break down point. That is an indication the index is struggling to go down. This is not how bear campaigns end. The last leg of a bear campaign is always a fear driven capitulation move down and exhibits the pattern of trending that breaks lows and does not come back above the breakaway points until the trend is complete. There was one government intervention that caused the huge one day rally on the 19th that moved well above the previous low and now a break of the September low and a rally back above it.
There was a very weak trend up in July and August and when the index is at this stage of a bear campaign the odds of this leg down struggling are very small. The two spikes this close together have all the characteristics of a low but something smells here. This would be an abnormal pattern of trending for the last leg down to end a bear campaign. The window in time I had to end this leg down and possibly the trend was the 15th of October plus or minus two days. If that isn't the low then it could run down into January from an early December or end of November high. If the index can show enough strength to move above the resistance I've drawn on the chart than that is likely what will occur.
LET'S LOOK AT THE 1969/1970 BEAR CAMPAIGN on a weekly

I've been indicating this will be the roadmap for our current trend. There are two very important points on this chart. First the last leg down, notice it is a vertical move down there are no weekly highs exceeded, no struggle down-- it is just a vertical move down. That is the pattern of trend that ends most bear trends. Second notice the arrow that indicates “NOW.” If this trend doesn't capitulate down, then this index could be in the same position as the 1970 index is highlighted. Keep this in mind
NOW LET'S LOOK AT OUR CURRENT BEAR CAMPAIGN

I'm sure you can see the similarity between these two trends. If this doesn't capitulate down and show the normal or vertical move down to complete this trend now and possible move to 1020. Then the index will likely show another weak rally into the 1200s and then show us the last leg down to or below 1020.
Last week I thought if the bill was passed the index would go up two days and collapse. Instead it didn't get passed and the index collapsed. This bill does not solve the major problems other than enriching a few investment and commercial banks. The fact that a bill as bad as the Paulson Bill could even be offered indicates how corrupt this whole situation has become. The October time window around the one year cycle still looks powerful.


