


Have you heard the following statements from your financial planner, mutual fund advisor, or stock broker?
- In the long term the market rises 8% per year.
- Investors cannot time the market. The best strategy for investing is to buy and hold for the long term.
How many decades does the "buy and hold" investor have to wait to get their 8% per year return from the Dow Jones Industrial Average?
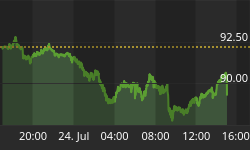
This is what a chart of the Dow Jones looks like for nearly the past nine years.

How many years (or decades) of holding an investment is considered "long term"? The above chart illustrates that the "buy and hold investor" that entered the market in the year 2000 would have made a negative 23% total return on their money by October 9, 2008. Keep in mind that this return does not factor inflation into the equation. Since the year 2000 how much more does it cost to buy food, get an education, heat your home, get medical treatment, buy gas for your car etc.? The "buy and hold" investor has done significantly worse when factoring in the effects of inflation into their investment returns.
When comparing the Dow Jones directly to another asset such as gold, we bypass the distortion of the fluctuating US dollar measuring stick. The following chart illustrates the performance of the Dow Jones when priced in gold.

In this chart we can see how much the Dow Jones has fallen in value relative to gold, and conversely how much gold has risen relative to the Dow Jones. In the year 2000 it took roughly 40 ounces of gold to buy one share of the Dow Jones industrial average. Today it takes roughly 10 ounces of gold to buy one share of the Dow Jones. In other words, relative to gold, the Dow Jones has lost roughly 75.5% of its value.
We are not suggesting that the average investor try to time the market on a day to day basis. Instead we are trying to illustrate why we attempt to time the "big picture" of large shifts of capital from overvalued asset classes to undervalued asset classes. We believe that timing these large, multi decade cycles may be the most important investing strategy an investor could follow. These long term "mega trends" are where significant profit is made as the rising tide of the bull market raises all boats.
A good example of these shifts of capital is seen from the 1960's to 1980 when investors fled paper assets such as stocks and bonds in favor of hard assets such as gold and silver, but because markets are cyclical and not linear that same money flew out of hard assets and into paper assets from 1980 to 2000. In our opinion the large cyclical transfer from paper assets to hard assets started once again in 2000 until present. We believe investors are losing faith in paper assets and are once again in the process of transferring their money into the security of hard assets.
Markets are cyclical and one day the sun will shine brightly on financial stocks, technology stocks and the like again. But in our opinion this recent drop in the paper markets is not a simple pull back and "buying opportunity". Instead we believe this "correction" is a full blown "crash" that will take many years to recover from. Make no mistake that when the news of falling massive, financial corporation's no longer shocks the average investor because it has become so common place, a significant consequence is likely hiding around the corner. It is during times like this that we look for assets the world "needs" instead of assets the world "wants".
At www.investmentscore.com we do not know exactly when a market will crash, bottom, or even explode higher. But we use long term, big picture charts to help guide us in making long term investment decisions. Currently we are long term precious metals bulls and we expect spectacular returns in the coming years. But the key to profiting in any market is not only knowing when to buy but also when to sell. To learn more about our approach to investing and to sign up for our free newsletter please visit us at www.investmentscore.com.


