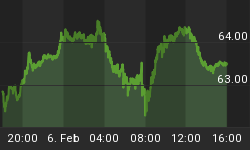
The good news is the market is behaving as expected, i.e., rising on low volume.
Except for Friday, next week should follow the same pattern.
Friday offers a mixed bag:
The last day of the week following a holiday you would expect to be up.
The first day of the new year, however, has a pretty poor record.
There has only been one Friday January 2 in the past 15 years (1998) so we do not have a good sampling do draw from.
The tables below show the performance of the Russell 2000 (R2K) and the S&P 500 (SPX) for the last 3 trading days of December and the first Trading day of January.
The year indicated in the tables below is for the following January.
| R2K | Day3 | Day2 | Day1 | Day1 | Totals |
| 1989-1 | 0.19% 3 | 0.52% 4 | 1.14% 5 | -0.39% 2 | 1.46% |
| 1990-2 | 0.37% 3 | 0.15% 4 | 1.23% 5 | 0.98% 2 | 2.73% |
| 1991-3 | -0.16% 4 | -0.12% 5 | 1.33% 1 | -0.41% 3 | 0.63% |
| 1992-4 | 1.03% 5 | 1.96% 1 | 1.11% 2 | 0.02% 4 | 4.12% |
| 1993-1 | 0.44% 2 | -0.25% 3 | 2.17% 4 | -0.57% 1 | 1.80% |
| 1994-2 | 0.90% 3 | 0.07% 4 | 0.94% 5 | -0.80% 1 | 1.11% |
| 1995-3 | -0.27% 3 | 0.66% 4 | 1.41% 5 | -1.25% 2 | 0.55% |
| 1996-4 | 0.40% 3 | -0.03% 4 | 0.63% 5 | 0.27% 2 | 1.27% |
| 1997-1 | 0.41% 5 | 0.23% 1 | 0.73% 2 | -1.01% 4 | 0.35% |
| 1998-2 | 1.23% 1 | 1.72% 2 | 0.69% 3 | -0.11% 5 | 3.53% |
| 1999-3 | 0.52% 2 | 0.37% 3 | 2.44% 4 | -0.17% 1 | 3.16% |
| 2000-4 | 1.75% 3 | -0.09% 4 | 1.64% 5 | -1.53% 1 | 1.78% |
| 2001-1 | 2.72% 3 | 3.07% 4 | -2.13% 5 | -4.35% 2 | -0.69% |
| 2002-2 | 0.50% 4 | 0.20% 5 | -1.04% 1 | -0.27% 3 | -0.61% |
| 2003-3 | -1.35% 5 | -0.50% 1 | 0.22% 2 | 2.48% 4 | 0.85% |
| Averages | 0.58% | 0.53% | 0.83% | -0.47% | 1.47% |
| % Winners | 80% | 67% | 87% | 27% | |
| SPX | Day3 | Day2 | Day1 | Day1 | Totals |
| 1989-1 | 0.09% 3 | 0.84% 4 | -0.60% 5 | -0.87% 2 | -0.54% |
| 1990-2 | 0.58% 3 | 0.53% 4 | 0.78% 5 | 1.78% 2 | 3.67% |
| 1991-3 | -0.77% 4 | 0.13% 5 | 0.46% 1 | -1.14% 3 | -1.33% |
| 1992-4 | 0.40% 5 | 2.14% 1 | 0.47% 2 | 0.04% 4 | 3.05% |
| 1993-1 | -0.27% 2 | 0.19% 3 | -0.71% 4 | -0.08% 1 | -0.86% |
| 1994-2 | -0.08% 3 | -0.41% 4 | -0.47% 5 | -0.22% 1 | -1.17% |
| 1995-3 | -0.35% 3 | 0.07% 4 | -0.41% 5 | -0.03% 2 | -0.73% |
| 1996-4 | 0.04% 3 | -0.07% 4 | 0.29% 5 | 0.78% 2 | 1.04% |
| 1997-1 | 0.13% 5 | -0.39% 1 | -1.74% 2 | -0.50% 4 | -2.50% |
| 1998-2 | 1.80% 1 | 1.83% 2 | -0.04% 3 | 0.48% 5 | 4.07% |
| 1999-3 | 1.33% 2 | -0.80% 3 | -0.22% 4 | -0.09% 1 | 0.23% |
| 2000-4 | 0.40% 3 | 0.07% 4 | 0.33% 5 | -0.95% 1 | -0.16% |
| 2001-1 | 1.04% 3 | 0.40% 4 | -1.04% 5 | -2.80% 2 | -2.41% |
| 2002-2 | 0.68% 4 | 0.34% 5 | -1.11% 1 | 0.57% 3 | 0.47% |
| 2003-3 | -1.60% 5 | 0.46% 1 | 0.05% 2 | 3.32% 4 | 2.22% |
| Averages | 0.23% | 0.36% | -0.26% | 0.02% | 0.34% |
| % Winners | 67% | 73% | 40% | 40% | |
Typically of all seasonally strong periods the returns have been much better for the small caps. The historical performance for the last three trading days of the year has been extraordinarily good while the first trading day of the year has been extraordinarily bad.
The NASDAQ new high indicator (a 10% trend of NASDAQ 52 week new highs) has been a remarkably good indicator of the direction of the overall market. It lags by a day or two, but smoothes out most of the price gyrations leaving a smooth indicator of direction. The indicator is shown in green on the chart below along with the NASDAQ composite in red. The vertical dashed lines are drawn on the first trading day each month on the chart. You can see for the past two weeks, while the index has been rising, the new high indicator has been falling.

The weakness indicated in the chart above makes me a little uneasy about next week, but seasonally strong periods often appear to defy gravity.
I expect the major indices to be higher at the close Friday January 2 than they were at the close December 26.


