


The good news is the same as last week, by nearly every intermediate term technical measure, the market is in good shape.
- The NYSE AD line made new cycle highs last week.
- There have been virtually no new lows on either the NYSE or NASDAQ.
- The 10% trend (19 day EMA) of NYSE new highs hit an all time high last week.
All of this implies new highs in the blue chip indices in the next 2 to 6 weeks.
The list of positives is a little shorter this week. Most significant, the NASDAQ new high indicator turned downward last week.
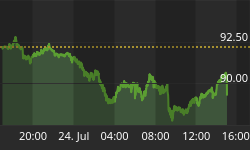
The NASDAQ new high indicator, shown in the chart below is not predictive and it often has a day or two lag, but it does a good job of smoothing out the wiggles. As of Thursday's close, it turned downward. The current value of the indicator is 286 so any number of NASDAQ new highs greater than 286 will turn the indicator upward while any number less than 286 will pull it downward.

There has been a lot of research on levels of the NYSE new high indicator that indicate there is little intermediate term risk when the value of the indicator is above 100. The current value of that indicator is just off its all time high at 446. The previous all time high of 273 was reached March 24, 1998.
The current levels of the new high indicators suggest very little intermediate term risk, however, with both indicators heading downward, their current direction implies short term risk.
Seasonality for next week is interesting because, although it nearly always favors the small caps, for the past 15 years at least, the tables below indicate the large caps have decisively outperformed the small caps during the last 5 trading days of January.
Last 5 days of January
The number following the daily return represents the day of the week;
= Monday, 2 = Tuesday etc.
The number following the year is its position in the presidential cycle.
| Russell2K | Day5 | Day4 | Day3 | Day2 | Day1 | Totals |
| 1989-1 | 0.22% 3 | 0.49% 4 | 0.27% 5 | 0.06% 1 | 0.54% 2 | 1.58% |
| 1990-2 | -0.11% 4 | -0.87% 5 | -1.07% 1 | -1.50% 2 | 0.42% 3 | -3.13% |
| 1991-3 | 1.07% 5 | 0.96% 1 | 1.05% 2 | 2.01% 3 | 1.51% 4 | 6.59% |
| 1992-4 | -0.18% 1 | -0.04% 2 | -0.54% 3 | 0.49% 4 | 0.15% 5 | -0.12% |
| 1993-1 | 0.80% 1 | 0.52% 2 | -1.11% 3 | -0.35% 4 | 0.40% 5 | 0.26% |
| 1994-2 | -0.32% 2 | 0.30% 3 | 0.31% 4 | 0.52% 5 | 0.56% 1 | 1.38% |
| 1995-3 | -0.06% 3 | -0.29% 4 | 0.16% 5 | -0.77% 1 | 0.12% 2 | -0.84% |
| 1996-4 | 0.04% 4 | 0.21% 5 | 0.19% 1 | 0.50% 2 | 0.64% 3 | 1.59% |
| 1997-1 | -0.71% 1 | 0.26% 2 | -0.06% 3 | 0.56% 4 | 0.31% 5 | 0.36% |
| 1998-2 | -0.89% 1 | 0.36% 2 | 1.44% 3 | 0.79% 4 | -0.45% 5 | 1.24% |
| 1999-3 | -0.08% 1 | 0.76% 2 | -0.99% 3 | 0.68% 4 | 0.77% 5 | 1.14% |
| 2000-4 | -0.26% 2 | -0.11% 3 | -0.77% 4 | -2.40% 5 | -1.66% 1 | -5.20% |
| 2001-1 | -0.65% 4 | -0.06% 5 | 1.85% 1 | 0.74% 2 | -0.65% 3 | 1.23% |
| 2002-2 | -0.08% 5 | 0.40% 1 | -1.52% 2 | 1.21% 3 | 0.70% 4 | 0.72% |
| 2003-3 | -1.73% 1 | 1.25% 2 | 0.45% 3 | -1.93% 4 | 1.24% 5 | -0.72% |
| Averages | -0.19% | 0.28% | -0.02% | 0.04% | 0.31% | 0.41% |
| Winners | 27% | 67% | 53% | 67% | 80% | |
| S&P 500 | Day5 | Day4 | Day3 | Day2 | Day1 | Totals |
| 1989-1 | 0.23% 3 | 0.88% 4 | 0.73% 5 | 0.40% 1 | 0.84% 2 | 3.08% |
| 1990-2 | -1.27% 4 | -0.09% 5 | -0.18% 1 | -0.68% 2 | 1.89% 3 | -0.33% |
| 1991-3 | 0.39% 5 | -0.01% 1 | -0.06% 2 | 1.51% 3 | 0.89% 4 | 2.71% |
| 1992-4 | -0.12% 1 | -0.01% 2 | -1.11% 3 | 0.31% 4 | -0.69% 5 | -1.62% |
| 1993-1 | 0.89% 1 | -0.01% 2 | -0.42% 3 | 0.13% 4 | 0.03% 5 | 0.62% |
| 1994-2 | -0.22% 2 | 0.48% 3 | 0.81% 4 | 0.35% 5 | 0.61% 1 | 2.03% |
| 1995-3 | 0.34% 3 | 0.19% 4 | 0.44% 5 | -0.40% 1 | 0.41% 2 | 0.98% |
| 1996-4 | -0.47% 4 | 0.74% 5 | 0.42% 1 | 0.95% 2 | 0.93% 3 | 2.57% |
| 1997-1 | -0.71% 1 | 0.00% 2 | 0.98% 3 | 1.51% 4 | 0.25% 5 | 2.03% |
| 1998-2 | -0.07% 1 | 1.26% 2 | 0.87% 3 | 0.82% 4 | -0.53% 5 | 2.36% |
| 1999-3 | 0.72% 1 | 1.49% 2 | -0.73% 3 | 1.79% 4 | 1.13% 5 | 4.39% |
| 2000-4 | 0.61% 2 | -0.42% 3 | -0.39% 4 | -2.75% 5 | 2.52% 1 | -0.43% |
| 2001-1 | -0.50% 4 | -0.19% 5 | 0.68% 1 | 0.70% 2 | -0.56% 3 | 0.13% |
| 2002-2 | 0.10% 5 | -0.02% 1 | -2.86% 2 | 1.17% 3 | 1.49% 4 | -0.11% |
| 2003-3 | -1.62% 1 | 1.31% 2 | 0.68% 3 | -2.28% 4 | 1.31% 5 | -0.60% |
| Averages | -0.11% | 0.40% | -0.01% | 0.23% | 0.70% | 1.19% |
| Winners | 47% | 50% | 53% | 73% | 80% | |
Weakness in the DJIA and NASDAQ last week relieved some of their overbought condition and end of January seasonal strength should help next week.
I expect the major indices will be higher at the close Friday January 30 than they were at the close Friday January 23.
Last week the DJIA and NASDAQ composite were down while the S&P 500 and Russell 2000 were up so I am calling my forecast for last week a tie.


