


Market Wrap
Week Ending 2/27/09
Bonds
Months ago I questioned if bonds were the next bubble to burst. At the time bonds were roaring full steam ahead. Investors, speculators, and those simply looking for a safe haven during the financial meltdown, couldn't buy bonds fast enough.
Bonds have now come under pressure. The market is waking up and realizing just how much debt (bonds) is going to be issued to fund all the bailout schemes.
The spin masters can put any name on it they want, but when all is said and done, it still comes out as more debt, which is what got us into this mess to start with.
More of the same will not get us out.
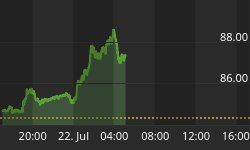
As the next chart shows, bond prices have been falling since late Dec., which means interest rates have been rising (per the second chart).


Not only is an ever increasing amount of bonds (debt) needed to fund the bailout schemes, but higher interest rates (cost) are required to attract buyers. This is why more of that which got us into this fix, i.e. excessive debt levels, cannot possibly be the answer as to how to get us out.
Savings and a reduction in consumption are needed. In other words: fiscal discipline to spend less and save more: on individual, local, state, and federal levels - from main street to Wall Street.
During late 2008 and into 2009 several inter-market relationships or dynamics changed. Earlier we saw that Yen/Dollar and Euro/Gold have changed.
The charts below show that Gold/Oil and T-Bonds/Gold have also changed. The common denominator in all of these relationships is GOLD. Since late 2008 something is "different" with gold.


What happened was the financial crisis and investor's perceptions that gold is the safest asset existent. It retains purchasing power better than any of currency or asset.
There has been a flight to safety into gold. The U.S. dollar has experienced the same, but to a lesser degree. For awhile, both the Yen and T-bonds were experiencing a flight to safety, but both have given up their recent strength.
It is a testament to gold's soundness as real money that these inter-market relationships have changed. Because of the fragile condition of the global financial system, it is not a given that these relationships will remain as is. Systemic risk is present that can and will play havoc with various assets.
Unless and until the financial crisis is cured, gold will continue to outperform all other currencies and assets. This is why gold is known as the sovereign of sovereigns.
The next chart shows every sector of the stock market is under water, yet gold is up over 8%. Gold performs well in either deflation or inflation, as each represents a dislocation of the paper money system at opposing poles.

Gold
Gold was down $59.70 (continuous contract) to close at $942.50 for a 5.96% loss. On my website I have been asked if it's possible a double top is being put in. Of course it's possible; anything is possible. Let's look at what's probable.
A double top is not completed or "confirmed" until support is broken below. As the chart shows - support is down around the $680.00 area. That's one hell of a drop, and is not the most probable scenario.
Back in September when the 50 dma crossed BELOW the 200 dma, gold's enemies attacked in full force: gold was falling apart and about to enter a bear market. When gold rallied, but made a lower high last autumn, once again the calls were against gold.
Now, gold has rallied above the autumn high and the summer high before that. These are moves of strength, not weakness. The lower highs have finally been bettered. After doing this much work - gold has earned a rest.
A corrective consolidation will simply provide a stronger base from which to launch the next move up in the on-going bull market.

Weeks ago when everyone was euphoric over gold, I stated that I was still very bullish long term, but that the price action was getting a bit frothy, and that a pullback was most likely. The pullback is occurring, which should be of no surprise.
The most dominant chart feature is the gold cross - the 50 dma crossing up and above the 200 dma. It can be seen on the chart above; and on the chart below, of all gold crosses since the beginning of the bull market.
These are very powerful crossovers that have led to new legs up in the on-going bull market. Sure it could be different this time, but the odds say that gold is very strong right now, and is simply undergoing a healthy correction and consolidation.
It is what it is until proven otherwise. The last piece of the puzzle to fit into place will be a new high that turns resistance above $1000 into support. Then the next major leg up in the on-going secular bull market will begin.

This is why last week's report said:
A new phase in the gold bull is about to be entered upon, regardless if a correction first appears as suspected.
The monthly chart of GLD shows a positive RSI divergence and MACD turning up for a possible bullish crossover.
This is gold's long term chart and it's showing that a new leg up is forming.
When coupled with the above charts, the weight of the evidence strongly suggests a bullish resolution - not a double top.

As of now gold is alive and well, and is in a "B" correction that will put in a higher low; then a "C" leg up to new highs will begin.
This is the most probable scenario unless the bull market turns in to a bear, which at the present time is the least likely scenario.
The above is an excerpt from the full market wrap report available at the Honest Money Gold & Silver Report website. This week's twenty-five page report contains twenty-seven charts & graphs, including positions held in the model portfolio and on our stock watch list. Available on the site is an audio version of the book Honest Money.
Good luck. Good trading. Good health, and that's a wrap.

Come visit our website: Honest Money Gold & Silver Report
New Book Now Available - Honest Money


