


Asha Bangalore (Northern Trust): Food prices raise wholesale price index
"The Producer Price Index (PPI) of Finished Goods increased 0.3% in April, following a 1.2% drop in the prior month. Food prices advanced 1.5% in April compared with declines in February and March. The energy price index edged down 0.1% in April after a 5.5% drop in March."

Source: Asha Bangalore, Northern Trust - Daily Global Commentary, May 14, 2009.
Asha Bangalore (Northern Trust): The hike in core consumer price index is temporary
"The Consumer Price Index (CPI) was unchanged in April following a 0.1% drop in the prior month. The energy price index fell 2.4% in April after a 3.0% drop in March. Energy prices are expected to show an increase in the May CPI report, based on the information available so far. The food price index fell 0.2%, the third consecutive monthly decline. In the first four months of the year the CPI has risen at an annual rate of 1.9% versus a 3.9% increase in all of 2008. On a year-to-year basis, the CPI has dropped 0.7% in April, the second consecutive monthly decline. The last time the CPI fell back-to-back for an extended period was in the 1954-1955 period.
"The core CPI, which excludes food and energy, rose 0.3% in April. The BLS indicated that over 40% of the increase in the core CPI was from higher tobacco prices for the second month. The tobacco price index went up 9.3% in April, which reflects the hike in federal excise tax on cigarettes. In addition, the jump in the medical care price index (+0.4%), higher prices for new cars (+0.4%), and gains in the shelter index (+0.2%) were the major gains recorded among the core items of the CPI. Lower prices for clothes (-0.2%) and air travel (-1.5%) helped to trim back the advance of the CPI in April. On a year-to-year basis, the core CPI rose 1.9% in April after holding between 1.7% and 1.8% for four straight months; the small acceleration reflects the hike in tobacco prices.
"The threat of inflation is not on the radar screen of the FOMC at the present time, the focus of the FOMC is financial market stability and economic growth. Financial."
Source: Asha Bangalore, Northern Trust - Daily Global Commentary, May 15, 2009.
Reuters: Former official slams Fed for inflation risk
"A sharp critic of the Federal Reserve and prominent authority on monetary policy on Tuesday slammed the US central bank for risking inflation and warned that government action had 'caused, prolonged and worsened' the country's financial crisis.
"John Taylor, a former undersecretary of the Treasury for international affairs and author of the widely cited Taylor Rule of central banking, ran his own numbers for the US economy and said the Fed's monetary stance was way too loose.
"'My calculation implies that we may not have as much time before the Fed has to remove excess reserves and raise the rate,' he said in remarks prepared for a financial markets conference hosted by the Federal Reserve Bank of Atlanta.
"'We don't know what will happen in the future, but there is a risk here and it is a systemic risk,' he said.
"He noted a recent Financial Times report of internal Fed estimates using the Taylor Rule. This found interest rates should be minus 5% at the moment to compensate for the headwinds on the US economy.
"But Taylor said that his own analysis suggested a rate of 0.5%, indicating that the Fed could have a lot less time to raise interest rates than it may currently think.
"In addition, the Fed has pumped hundreds of billions of dollars into the economy to support credit markets in the face of a severe US recession, and may find it very hard to remove this expansion by shrinking its balance sheet in the future.
"'While Federal Reserve officials say that they will be able to sell newly acquired assets at a sufficient rate to prevent these reserves from igniting inflation, they or their successors may face political difficulties in doing so.
"'That raises doubts and therefore risks. The risk is systemic because of the economy-wide harm such an outcome would cause,' Taylor said."
Source: Reuters, May 12, 2009.
PR Newswire: Foreclosure activity remains at record levels
"RealtyTrac, the online marketplace for foreclosure properties, today [Wednesday] released its April 2009 US Foreclosure Market Report, which shows foreclosure filings - default notices, auction sale notices and bank repossessions - were reported on 342,038 US properties during the month, an increase of less than 1% from the previous month and an increase of 32% from April 2008. The report also shows that one in every 374 US housing units received a foreclosure filing in April, the highest monthly foreclosure rate ever posted since RealtyTrac began issuing its report in January 2005.
"'Total foreclosure activity in April ended up slightly above the previous month, once again hitting a record-high level,' said James J. Saccacio, chief executive officer of RealtyTrac. 'Much of this activity is at the initial stages of foreclosure - the default and auction stages - while bank repossessions, or REOs, were down on a monthly and annual basis to their lowest level since March 2008. This suggests that many lenders and servicers are beginning foreclosure proceedings on delinquent loans that had been delayed by legislative and industry moratoria. It's likely that we'll see a corresponding spike in REOs as these loans move through the foreclosure process over the next few months.'"
Source: PR Newswire, May 13, 2009.
Bespoke: Gallup Well Being Index
"Gallup and Healthways started a number of daily polls at the start of 2008 that measure the well-being of Americans. Their main Well-Being Index 'has been developed to provide the official measure for health and well-being. It's the voice of Americans and the most ambitious effort ever undertaken to measure what people believe constitutes a good life.'
"The poll seems to be a good sentiment measure, and below we have overlaid a monthly chart of it with the S&P 500. As shown, the two tracked hand-in-hand until the end of 2008, when the Well Being Index began to positively diverge from the S&P 500. Throughout 2009, the Well Being Index has increased back to levels seen in September just before the US economy took a nose dive. While Well Being started increasing at the start of the year, the market didn't swing higher until March, so it at least led this rally. But a big reason for the Well Being rally probably had a lot to due with Obama's election, so the jury is still out on its effectiveness as a leading indicator. Nevertheless, it will be a good one to track in the years to come."

Source: Bespoke, May 11, 2009.
Financial Times: Goldman agrees $60 million subprime deal
"Goldman Sachs has agreed to a $60 million settlement to resolve claims by a Massachusetts regulator that it participated in unfair and deceptive lending practices involving subprime mortgages, it was announced on Monday.
"The settlement did not involve an admission of wrongdoing by the bank. But Martha Coakley, Massachusetts attorney-general, said Goldman had 'played a role' in the 'predatory lending' associated with the subprime market. In a statement, the bank said: 'Goldman Sachs is pleased to have resolved this matter.'
"Ms Coakley said Goldman agreed to forgo up to $50 million so it could restructure subprime loans it had helped underwrite or facilitate - in some cases forgiving up to half the unpaid balance. In addition, Goldman will pay $10 million to Massachusetts and continue to co-operate with the state's regulators.
"The settlement with Goldman, which was not a major player in the subprime market, suggests Ms Coakley is also investigating other Wall Street banks that participated in subprime lending."
Source: Greg Farrell, Financial Times, May 12, 2009.
Caroline Baum (Bloomberg): Curve watching beats room full of forecasters
"Like clockwork, the alarm bells are going off as long-term Treasury yields start their inevitable climb.
"'Rising Government Bond Yields Frustrate Central Banks,' trumpets yesterday's Wall Street Journal.
"'Rising bond yields present fresh Fed challenge,' according to the April 29 edition of the Financial Times.
"It's a funny thing about long-term interest rates. They're pro-cyclical. They tend to rise when the economy is doing well, when demand for credit is strong. They fall when the economy is in the tank, and the private sector isn't much interested in investing and spending.
"If there's a way to accommodate the increased demand for credit that goes hand in hand with recovery without pushing up the price, no one has figured it out just yet.
"For a time, the federal government's increased borrowing needs, both current and expected, were being met by more-than-willing lenders. The flight-to-quality into Treasuries drove yields to historic lows, with the benchmark 10-year note bottoming at 2.04% in December.
"Last Friday, the 10-year yield touched 3.38 percent as a proliferation of green shoots calmed investor fears of an endless dark winter.
"That's not good news for the Treasury, which has to pay interest on the rapidly expanding debt. For the Fed, however, rising yields are a sign its medicine is working.
"The yield curve, or spread, has several things going for it:
"First, it's a leading economic indicator, officially added to the index designed to predict the economy's ebbs and flows in 1996. It was a leader well before that, even though it was unofficial.
"Second, what you see is what you get. The spread is never revised, always available and in no way proprietary.
"Third, and most curious, the majority of economists don't get it. They see rising bond yields in isolation - without paying attention to what that price-setter, the Fed, is doing at the front end of the curve.
"It's the juxtaposition of short and long rates, not their level, that conveys information about monetary policy."
Source: Caroline Baum, Bloomberg, May 12, 2009.
Bloomberg: Bill Gross reduces US debt exposure
"Bill Gross, manager of Pacific Investment Management Co.'s $150 billion Total Return Fund, reduced his holdings of US government-related debt last month for the first time since January.
"Pimco's founder and co-chief investment officer cut the holdings to 26% in April from 28% in March, according to the Newport Beach, California-based company's Web site. In addition to Treasuries, the government debt category can include inflation-linked Treasuries, so-called agency debt, interest-rate derivatives and bank debt backed by the FDIC.
"Gross' holdings of government debt in March were the most since April 2007 as he advised investors to favor debt of agencies such as Fannie Mae that have US government guarantees. Gross has counseled favoring stable income over speculative growth, saying 2009 marks a 'demarcation' in economic policy under the administration of President Barack Obama.
"This year 'represents the beginning of government policy counterpunching', Gross wrote in his May investment outlook posted May 4 on Pimco's Web site. 'Asset values should be negatively affected.'
"While the government debt category includes Treasuries, Gross has said that Pimco isn't interested in buying them. Gross held about $4 billion in Treasuries in the fund at the end of March, or about 2.8% of the total, Mark Porterfield, a Pimco spokesman, said in an e-mail April 13. That was about the same as at the end of February, he wrote."
Source: Dakin Campbell, Bloomberg, May 11, 2009.
Bloomberg: Mortgages over 5% mean Fed purchases as bonds slump
"The world's biggest investors are increasing bets that Federal Reserve Chairman Ben Bernanke will boost purchases of Treasuries as the steepest losses on government debt since 1994 send mortgage rates above 5%.
"The slump in Treasuries the past seven weeks pushed yields on longer-maturity bonds up by more than half a percentage point and sent average rates on 30-year mortgages to the highest since the start of April, according to North Palm Beach, Florida-based Bankrate.com. Policy makers said March 18 they were committing 'greater support to mortgage lending and housing markets' when they pledged to buy as much as $300 billion of Treasuries and stepped up purchases of bonds backed by home loans.
"BlackRock Inc., American Century Investments, Federated Investors and Pioneer Investment Management say it's time to buy Treasuries because the Fed will need to expand its purchases to keep consumer borrowing costs from rising further. While higher bond yields, the 37% increase in the Standard & Poor's 500 Index since March 9 and US reports on housing and inventories show the economy may be stabilizing, Bernanke said May 5 that 'mortgage credit is still relatively tight'.
"'The Fed needs to consider increasing its purchases of Treasuries,' said Stuart Spodek, co-head of US bonds in New York at BlackRock, which manages $483 billion in debt. Spodek said he resumed buying Treasuries. 'We are still in a recession. It's quite bad. They need to stabilize long-term rates.'"
Source: Daniel Kruger, Bloomberg, May 11, 2009.
Bespoke: New equity offerings tick higher
"As more and more Financials do secondaries to raise money in hopes of paying back TARP (GS, MS, WFC, COF), the amount of new equity offerings in the US is coming back strong. December, January and March saw the smallest amount of new offerings in years, if not decades. But April saw more than $16 billion of equity capital raised, and May has already seen more than $17 billion.
"And the companies that are doing the offerings are seeing share prices rally on the news because the fact that they can raise capital is being treated as a positive. In a market that was starved for deals for some time, it's good to see some money begin to flow back in."

Source: Bespoke, May 11, 2009.
CNBC: Dr. Doom - money printing pushed stocks up
"Major central banks' efforts to lift the world economy by printing money have boosted asset prices, so stocks are unlikely to hit their lows from November and March, Marc Faber, the author of 'The Gloom, Boom & Doom Report', wrote in his latest research report.
"'I have explained repeatedly in the past that if a government is really determined to try and postpone an inevitable collapse by 'printing money' in order to lift or support asset prices, it can be done,' Faber wrote.
"'This is not to say that the global economy is about to embark on a strong and sustainable growth phase. It also doesn't mean that a new bull market in global equities a la 1982-2000 has begun,' he said.
"'But I think that, at least in nominal terms (inflation-adjusted), the global printing presses being run by the world's central banks and fiscal deficits have begun to impact asset prices positively,' Faber wrote.
"Many investors did not take advantage of the recent rally because they thought it was a bear-market rally, so they stayed on the sidelined, hoarding cash. But stocks are not likely to collapse, as more players take courage to dip into the market, he said.
"'Put yourself in the shoes of a fund manager who, in the last 18 months, has lost 50% of his clients' money and missed the recent rally,' Faber wrote.
"'What is he likely to do? I would think he would be inclined to purchase equities as they correct the sharp advance since early March, especially as the economic news in the near term becomes less negative,' he said.
"But very high volatility and 'price fluctuations that don't appear to make any sense' will be the new dominant characteristic of the market, he warned.
"The lows reached by resource and mining stocks, as well as Asian equities and most emerging markets, are likely to hold for now, according to Faber. But the US long-term government bond market 'has the highest probability' of having reached a high, he said."
Source: CNBC, May 15, 2009.
Richard Russell (Dow Theory Letters): What fundamentals could trigger break of March lows?
"Russell, it's all very interesting. What fundamentals do you think could cause the market to break the March lows?
"Answer - You want guesses? Here are mine. (1) A collapse of the dollar along with a collapse in the bond market. (2) The US losing the reserve status of the dollar. (3) US consumers going on a long and unexpected buying strike plus a consumer saving campaign that shocks the economists and the Fed. (4) The Fed unable to halt asset deflation. (5) Federal budget deficits growing completely out of control, the compounding interest on the federal debt paralyzing the country with the catastrophic result that nobody will lend money to the US.
"What to do? This is no longer a 'buy and hold' market. It's a survival market. To survive, cash in case of deflation, physical gold in case of inflation or hyper-inflation, DIA ETFs in case of an important cyclical bull market."
Source: Richard Russell, Dow Theory Letters, May 11, 2009.
Richard Russell (Dow Theory Letters): Are equities offering value?
"There's no question that the huge break in the market from late-2007 to March 2009 was primary bear market action. During the decline from Dow 14,164 to Dow 6,547, the Dow lost over half of its value in a period of just 17 months. In my book, that qualifies the decline from the 2007 high as a severe or major bear market (actually, it was the second worst bear market on record). Going back over history, major bear markets tend to end with stocks selling at great values. Or as previous Dow Theorists put it, 'stocks at bear market lows sell below known values'.
"So question - Have we seen stocks selling at great values or below known values in this bear market?
"Let's take a look at previous bear market bottoms.
"In July 1932, the Dow sold at a yield of 10.2%.
"In June 1949, the S&P sold at a yield of 7.6%
"In December 1974, the S&P sold at a yield of 5.1%.
"In April 1980, the S&P sold at a yield of 5.7%.
"In September 1982, the S&P sold at a yield of 6.3%.
"And what was the yield on the S&P in March 2009 (the 'supposed' bear market bottom)? The yield on the S&P in March 2009 was 3.58%, hardly indicative of the bottom of a great bear market. Actually 3.58% is more what I'd expect at a market top. The current S&P dividend is now 2.45%."
Source: Richard Russell, Dow Theory Letters, May 11, 2009.
The Wall Street Journal: By most measures, stocks no longer look cheap
"The outlook for stocks has brightened but, thanks to the big rally of the past two months, the market is no longer a bargain.
"By many measures, stocks are still on the cheaper side of the ledger. But they are approaching levels that bring them closer to long-term averages, making them neither a deal nor expensive.
"As a result, valuation has shifted from being a talking point of the bulls to one used by those bearish on the near-term outlook. And even many of those who think the market has hit bottom - a rapidly growing group - say valuations now suggest investors should tread more carefully.
"For now, the 'less bad' news has been enough for stock investors. Last week, the US government's stress tests showed a number of the country's biggest banks needed capital, but in largely manageable amounts. April chain stores sales were better than expected, reinforcing the idea that the bulk of the pullback in consumer spending is over.
"On balance, first-quarter earnings had enough positive surprises to cheer investors.
"While the rebound was a relief for battered stock investors, it complicated matters for those still trying to decide whether to get in or add new holdings. Higher prices have made stocks less of a screaming buy by several valuation measures.
"For example, based on the last 12 months of operating earnings, the S&P 500 was changing hands late last week at a price-to-earnings ratio of 14.7, according to Morgan Stanley.
"That is still below the average trailing P/E of 17 for the last 25 years but up sharply from 10.5 in February.
"Looking ahead to expected earnings for the next year, the story is less compelling for buying stocks. The S&P 500 was at a forward P/E of 14.5 late last week compared with a 25-year average of 15, according to the Morgan Stanley data.
"But many investors are reluctant to put too much weight on the forward P/E ratio during a period of significant uncertainty about the earnings outlook.
"Last October and November, for example, the S&P 500 appeared to be extremely cheap on that basis, trading below a P/E of 11. But it turned out that analysts had wildly overestimated the earnings for the year ahead.
"Analysts had forecast 2009 S&P 500 operating earnings of $89 a share; that is now down to $57. But for 2010, the consensus calls for an almost 30% rebound.
"Many investors also take issue with basing valuations against even historical earnings posted through the middle part of this decade. Profits from the period of record earnings growth that lasted into 2007 are now widely seen as having been significantly inflated by the credit and housing bubble.
"And current as-reported earnings, which don't exclude one-time charge-offs, are creating readings seen as distorted. At the start of this month, the S&P 500 was at a P/E of 131 on that metric, according to Ned Davis Research. That is a record high that dwarfs the long-term average just south of 20.
"In this environment, valuation measures that compare stocks to longer-run earnings trends gain favor because they smooth out the cyclical peaks and valleys.
"Probably the most widely followed of these barometers, often known as 'normalized' earnings, is the one created by Yale University professor Robert Shiller.
"He compares stock prices to a 10-year trend in earnings adjusted for inflation. In March, his normalized P/E ratio dropped toward 13, its lowest since 1986.
"Now the measure is close to the historical average, with a reading of 15.9 at last Wednesday's close of 920 for the S&P 500. That's a reading that suggests 'average returns for the next 10 years,' Mr. Shiller says.
"'However,' he adds, 'I still think the market is risky right now.'"

Source: David Ranson, The Wall Street Journal, May 11, 2009.
Henry Blodget (Clusterstock); So, you think this is another great bull market ...
"Jubliation has replaced fear, and the consensus is now that the second-worst bear market in US history ended on March 9th and it's all champagne and roses from here.
"Let's hope.
"In the meantime, let's review what happened after the two other biggest bear market bottoms of the past century, 1932 and 1974. In both cases, as now, the market had a sharp rally off the lows.
"In real terms (after adjusting for inflation), the 1932 market almost doubled in a year. The 1974 market, meanwhile, jumped about 35% over two years.
"But it's what happened after that that matters now.
"After doubling off the low, the 1930s bear market pushed another 50% higher over the next three years to 1937 (not bad!). But it then got cut in half again, and it remained below the 1937 peak for 15 years. In 1949, 17 years after the 1932 bear-market low, when the next secular bull market finally began again, the market was 50% below the 1937 rebound peak and about 70% below the 1929 bull-market peak.
"In 1974, the market rebounded 35% in a couple of years. In 1982, however, eight years later, when the actual bull market began, it was back below the 1974 low. The 1973 peak, of course, was lower than the 1966 high, so the bear market that ended in 1982 was actually 16 years long.
"That's why they call them 'secular' bear markets.
"So even if March 9th was the bottom of a Great Bear Market that took stocks down 60%+ in 9 years from the 2000 peak (in real terms), let us not celebrate too much about what is likely coming next. As Jeremy Grantham has said, the great bear markets don't hurry, and this one probably has a long way to run."
Source: Henry Blodget, Clusterstock, May 10, 2009.
Ambrose Evans-Pritchard (Telegraph): Enjoy the rally while it lasts - but expect to take a sucker punch
"Bear market rallies can be explosive. Japan had four violent spikes during its Lost Decade (33%, 55%, 44% and 79%). Wall Street had seven during the Great Depression, lasting 40 days on average. The spring of 1931 was a corker.
"James Montier at Société Générale said that even hard-bitten bears are starting to throw in the towel, suspecting that we really are on the cusp of new boom. That is a tell-tale sign.
"Prolonged suckers' rallies tend to be especially vicious as they force everyone back into the market before cruelly dashing them on the rocks of despair yet again,' he said. Genuine bottoms tend to be 'quiet affairs', carved slowly in a fog of investor gloom.
"Another sign of fakery - apart from the implausible 'V' shape - is the 'dash for trash' in this rally. The mostly heavily shorted stocks are up 70%: the least shorted are up 21%. Stocks with bad fundamentals in SocGen's model (Anheuser-Busch, Cairn Energy, Ericsson) are up 60%: the best are up 30%.
"Teun Draaisma, Morgan Stanley's stock guru, expects another shake-out. 'We think the bear market rally will end sooner rather than later. None of our signposts of the next bull market has flashed green yet. We're not convinced the banking system has been fully fixed,' he said
"Mr Draaisma said US housing busts typically last nearly about 42 months. We are just 26 months into this one. The overhang of unsold properties on the US market is still near a record 11 months. He expects the new bull market to kick off later this year - perhaps in October - anticipating real recovery in 2010.
"The echoes of 1931 are ominous. That year began with green shoots, until Austria's Credit-Anstalt buckled in the summer and took Central Europe with it. Continentals who still thought it was an American crisis learned otherwise. Plus a change."
Click here for the full article.
Source: Ambrose Evans-Pritchard, Telegraph, May 11, 2009.
Bespoke: Relative strength - sector rotation in motion
"The charts below highlight the relative strength for the Consumer Discretionary, Consumer Staples, Health Care, and Industrial sectors over the last year. In each chart, a rising line indicates the sector is outperforming the S&P 500 while a declining line indicates underperformance. We have also included markers to show those days when the Fed cut rates (red dots) and meetings where they left rates unchanged (black dots).
"As shown in the charts below, over the last few trading days, there has been a clear rotation out of cyclical sectors like Consumer Discretionary and Industrials and into defensive sectors like Consumer Staples and Health Care. Given the previous run in the cyclicals, some profit taking is to be expected, but with the string of weaker than expected economic reports we have seen this week, bulls are hoping this isn't the beginning of a new trend."

Source: Bespoke, May 14, 2009.
Bill King (The King Report): How to navigate equity markets with fully invested mandate
"A portfolio manager asked us a great question: 'How does an institutional money manager with a mandate to always be fully invested with no short or hedge recourse navigate these troubled waters?'
"The most reasonable avenue given those parameters that we could conceive is some variation of sector rotation. When the market appears ready to rally high-beta (like techs), savagely beaten (finance) and advantaged sectors (building materials) should be over-weighted and defensive sectors under-weighted.
"When inevitable rebound rallies appear, one should rotate into defensive sectors or if possible cash-like positions. Of course tactics are probably more important than strategy. Ergo, one should have a plan that entails a gradual rotation and re-weighting as the market ebbs and flows.
"One of the clues that the recent rally might be ending is that the financial stocks, due to issuance and patsy exhaustion, have underperformed the S&P 500 the past week. Nasdaq and the Russell 2000 started to underperform the S&P 500 after the grandly bullish seasonal for stocks ended on April 30."
Source: Bill King, The King Report, May 13, 2009.
Bloomberg: Mobius says Latin America commodity producers are "attractive"
"Shares of Latin American commodity producers are 'attractive' investments and the region's banks are in 'good shape' because they hold few bad loans, Templeton Asset Management's Mark Mobius said.
"'Commodity companies should remain profitable and constitute attractive investment opportunities' despite declines in oil and metals prices last year, Mobius, who helps oversee about $20 billion in emerging-market assets at Templeton, said in an e-mailed statement today [Wednesday]. 'Latin American banks have minimal exposure to the toxic assets that have plagued financial institutions elsewhere. They are in a strong position to benefit from a recovery in the global markets.'"
Source: Michael Patterson, Bloomberg, May 13, 2009.
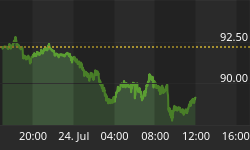
Bespoke: US Dollar Index enters downtrend
"After failing to take out its March highs on its most recent rally, the US Dollar Index has since broken below its recent lows and entered into a new downtrend. The Dollar Index also recently broke below its 200-day moving average, which is another negative technical sign."

Source: Bespoke, May 12, 2009
Eoin Treacy (Fullermoney): US dollar heading lower
"The US dollar exhibited remarkable relative strength as it attracted massive inflows from investors worried about the safety of their cash. As currencies, other than the Yen, weakened against the greenback, rationalizations stating that the dollar is a true safe haven or that since the US was first into the crisis, it would be first out, emerged.
"However, none of these arguments address the underlying problems in the US economy such as the budget and trade deficits, financial sector balance sheet issues or the very real risk that the US administration will be tempted to print its way our of trouble.
"The impressive rallies in stock and commodity markets over the last two months have succeeded in decreasing the perceived need for a safe haven and investors are now beginning to think more in terms of what they want to own in the 'post apocalyptic' world that is quickly developing.
"The US Dollar Index surged from early August to late November and while it pulled back sharply in December, the broad pattern has been characterised by a loss of momentum. One of the most bullish characteristics of the price action was the way the Index found support at the ascending moving average on a number of occasions since October. However, it broke below the MA last week and a sustained move back above 85 would now be needed to question potential for some additional lower to lateral ranging.
"The Australian dollar, New Zealand dollar, Norwegian krone, Brazilian real, Canadian dollar and Korean won have been leaders against the US dollar. The Singapore dollar, Taiwan dollar and Russian ruble are also exhibiting notable relative strength. The presence of so many commodity-related and Asian currencies in this group is a further indication that it is to these markets investors are looking for relative performance."
Source: Eoin Treacy, Fullermoney, May 12, 2009.
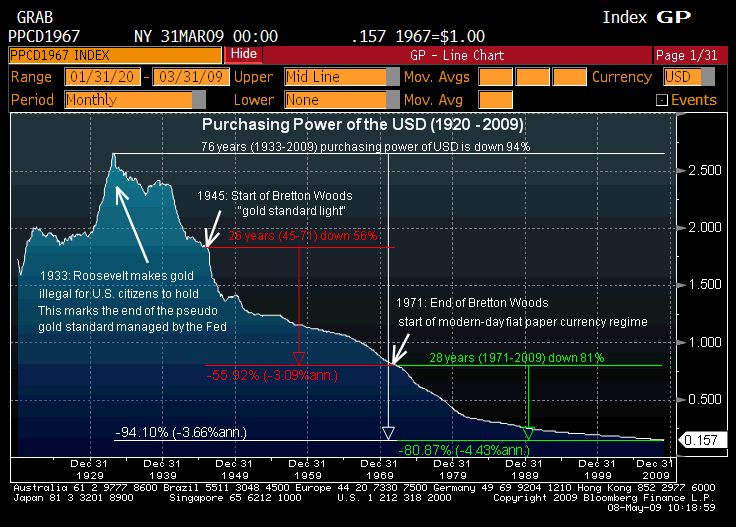
Seeking Alpha: Purchasing power of the US dollar

Source: Seeking Alpha, March 31, 2009.
Nouriel Roubini (The New York Times): The almighty renminbi?
"The 19th century was dominated by the British Empire, the 20th century by the United States. We may now be entering the Asian century, dominated by a rising China and its currency. While the dollar's status as the major reserve currency will not vanish overnight, we can no longer take it for granted. Sooner than we think, the dollar may be challenged by other currencies, most likely the Chinese renminbi. This would have serious costs for America, as our ability to finance our budget and trade deficits cheaply would disappear.
"Traditionally, empires that hold the global reserve currency are also net foreign creditors and net lenders. The British Empire declined - and the pound lost its status as the main global reserve currency - when Britain became a net debtor and a net borrower in World War II. Today, the United States is in a similar position. It is running huge budget and trade deficits, and is relying on the kindness of restless foreign creditors who are starting to feel uneasy about accumulating even more dollar assets. The resulting downfall of the dollar may be only a matter of time.
"But what could replace it? The British pound, the Japanese yen and the Swiss franc remain minor reserve currencies, as those countries are not major powers. Gold is still a barbaric relic whose value rises only when inflation is high. The euro is hobbled by concerns about the long-term viability of the European Monetary Union. That leaves the renminbi.
"China is a creditor country with large current account surpluses, a small budget deficit, much lower public debt as a share of GDP than the United States, and solid growth. And it is already taking steps toward challenging the supremacy of the dollar. Beijing has called for a new international reserve currency in the form of the International Monetary Fund's special drawing rights (a basket of dollars, euros, pounds and yen). China will soon want to see its own currency included in the basket, as well as the renminbi used as a means of payment in bilateral trade."
Click here for the full article.
Source: Nouriel Roubini, The New York Times, May 13, 2009.
Jeffrey Nichols (Mineweb): Gold price braces for return to long upward march
"From a long-term perspective, gold is a bargain at recent prices in the $900 to $930 an ounce ... and will remain so even as it begins to move into a higher trading range.
"Recent gold-market developments and technical price action - along with broader economic and financial-market developments - suggest gold is bracing for a resumption of its long march upward and a retest of its historic high in the months ahead.
"First and foremost, the bullish outlook for gold rests on the increasing likelihood of accelerating US inflation in the years to come - and an associated unprecedented rise in investor demand for the yellow metal.
"This nascent inflation has not yet been reflecting in world financial markets. But, judging from anecdotal evidence and the financial press - and the warnings of a growing number of institutional investment managers - we believe a gradual, subtle, but important, upward shift in inflation expectations is already underway."
Click here for the full article.
Source: Mineweb, May 15, 2009.
David Fuller (Fullermoney): Gold has bottomed
"... have a look at this 30-year chart of the gold price adjusted for CPI inflation, which we all know presents a hedonic picture of the USA's true inflation. Even allowing for this understatement, gold is still trading at less than half of its real (inflation-adjusted) peak in 1980.

"However, the real timing test is how gold is performing in the world's other currencies. Veteran subscribers may recall that bullion does best when it is appreciating simultaneously against all currencies.
"The key factors are that gold peaked in February, as we know, and fell back in a mostly uninterrupted decline against all viable currencies. Subsequently, gold has steadied against all of them. While this is not confirmation that gold will now rise persistently, it suggests that bullion has bottomed in areas of probable support."
Source: David Fuller, Fullermoney, January 14, 2009.
National Post: Faber - agricultural commodities offer great opportunity
"Going against the grain may be costly. Investing in agriculture today will be like investing in oil in 2001 to 2002 when oil prices halved to US$17 per barrel says Marc Faber editor of The Gloom, Boom & Doom Report. Agricultural commodities fell by half from June 2008 highs, but fundamentals remain strong says Faber.
"Faber points to a weak build in agricultural stocks (supplies) during the bumper harvest year of 2008. Low stocks, declining productivity, and increased demand persist from a long term perspective says Faber and will drive prices higher. Population growth is rising until 2030 and will have produced an additional billion mouths to feed between 2000 and 2012 alone.
"Faber is well known for highlighting long term trends in asset prices through a careful read of history. He points to the Green Revolution between 1976 to 1986 as the era when growth in food production transitioned from increased land usage to higher yielding agricultural methods yet those benefits have run their course. Productivity fell by almost half between 1990 and 2007 and will continue that trend over the next decade.
"Faber recommends only one-third allocation to commodity futures products due to the negative carry costs in those markets and also warns against farmland companies due to poor yields. One third of investor capital should go to listed agricultural companies and the other third to private companies. The long term opportunity is now."
Source: National Post, May 12, 2009.
Mark Lacey (Investec Asset Management): US natural gas is ripe for rebound
"In contrast with the strong performance of oil in 2009, the US natural gas market has seen steady downward pressure - and looks ripe for a rebound, says Mark Lacey, Global Energy portfolio co-manager at Investec Asset Management.
"'Onshore overproduction of gas has been met with declining industrial demand,' he says. 'While long-term US gas prices - 2011 and beyond - are above $7.20 per million British thermal units, spot prices have collapsed to about $3.80. This is the equivalent of about $23 a barrel of oil, making gas by far the cheapest source of energy in the US.'
"Mr Lacey argues that a potential rebalancing of the supply/demand equilibrium could push the US gas market from oversupply in 2009 to a slight deficit in 2010. And, without a pick-up in drilling activity from current levels, this deficit could widen even further in 2011. 'In this downturn, the cut in drilling activity has amounted to 54% in just seven months.
"'If gas prices remain at current levels, we do not expect activity to increase meaningfully in 2009,' he says.
"'Although we forecast that industrial demand will be weak in 2009 and potentially 2010, we believe this bearish scenario is now fully reflected in the market and that the current low levels of gas prices are unsustainable relative to coal and oil.
"'Could it now be time for investors to stop overlooking the US natural gas market?'"
Source: Mark Lacey, Investec Asset Management (via Financial Times), May 13, 2009.
Ifo: Ifo Economic Climate for the euro area
"The Ifo World Economic Climate for the euro area has improved in the second quarter of 2009 for the first time since autumn 2007. The rise in the Ifo indicator is the result of less negative expectations for the coming six months; the assessments of the current economic situation, however, have worsened further and now stand at a new all-time low.
"The current economic situation has been assessed as very unfavourable in all countries of the euro area without exception. The expectations for the coming six months, however, have improved in almost all countries of the euro area, with the exception of Greece. Ifo World Economic Survey (WES) experts in Belgium, Germany, Italy and Luxemburg anticipate improvement, and in Austria, France and the Netherlands at least a stabilisation of the economic situation in the coming six months is seen."

Source: Ifo, May 13, 2009.
Financial Times: Chinese exports fall sharply
"Chinese exports fell steeply in April for the sixth month in succession, suggesting the worst might not be over for the world's third largest economy.
"The total value of Chinese exports fell 22.6% to $91.9 billion last month compared with the same month a year earlier - a faster rate of decline than the 17.1% year-on-year drop in March.
"Imports fell 23% from a year earlier to $78.8 billion in what some analysts said was a sign that domestic investors remained unwilling to invest in new capacity. Exports rose 6.9% between March and April. However, the month-on-month figures are not seasonally adjusted and are regarded by analysts as misleading.
"The monthly trade figures are being watched more closely than usual after some economists criticised Beijing's stimulus efforts for relying too heavily on an assumption there would be a quick rebound in global demand for cheap Chinese exports."

Source: Jamil Anderlini, Financial Times, May 12, 2009.
CNBC: China has real domestic growth
"There is a real inner growth story happening in China, especially when one looks at the second- and third-tier cities, notes Tim Mulholland, MD at China-America Capital Company. He shares his observations with CNBC's Martin Soong."
Source: CNBC, May 13, 2009.
NDTV Profit: India's fiscal deficit puts rating at risk
"In just a few days from now a new government will be ready to take charge. But whoever comes to power will have a long list of economic worries to address including concerns over India's sovereign rating.
"A slowing economy and election year populist policies have meant that the new administration will be handed a huge deficit. And that has international rating agencies like Fitch and Standard and Poors' worried.
"Fitch Ratings on Thursday, for instance, warned that 'weakness in public finances if unaddressed could undermine sovereign creditworthiness'. The global ratings agency added that the new government faces challenges in balancing the need for stimulus and balancing its finances.
"While Fitch says that the deficit alone will not prompt a ratings cut, an inability to curtail expenditure may be a concern for ratings."
Source: Ira Duggal, NDTV Profit, May 15, 2009.
Financial Times: Zuma appointments ease business fears
"Jacob Zuma, South Africa's new president, on Sunday appointed Trevor Manuel, the country's respected finance minister, to head a powerful new centralised planning body, reassuring business critics who feared the new leader would shift policy to the left.
"In another appointment closely watched by financial markets, Pravin Gordhan, the highly regarded head of the country's tax collection service, is to take over from Mr Manuel at the finance ministry.
"Investors had feared that Mr Zuma, whose election campaign was supported by the Communist party and the trade union movement, might oversee a populist lurch to the left.
"But his opening appointments, as well as his inauguration speech on Saturday, have been pitched at reassuring investors. In particular, Mr Zuma has stressed the need to improve government efficiency and provide better public services, one of the shortcomings of the former government.
"Mr Zuma said on Sunday that Mr Manuel was being 'given a new structure, a very powerful structure, to work out a national plan of government. It will be all encompassing and is not going to exclude economic matters'.
"Jeff Gable, head of research at Absa Capital in Johannesburg, said: 'There is not a lot that is scary here. The government has fallen short on delivery and has now introduced a structure designed to put things right.'"
Source: Richard Lapper, Financial Times, May 10, 2009.
Did you enjoy this post? If so, click here to subscribe to updates to Investment Postcards from Cape Town by e-mail.


