


6/1/2009 10:22:07 AM
Introduction
This week we focus on the Epic Bull Bear clash and the anticipation of inflation with its consequence on the value of the U.S. dollar and the valuation of U.S. dollar denominated commodities.
Like what you see?
If so, subscribe to "The McMillan Portfolio" and see what I'm investing in now!
Anticipating Inflation
Traders seem to be anticipating inflation. Even though the Fed (U.S. Federal Reserve Bank) has formally stated that they don't expect inflation to be a factor for years, traders are positioning for inflation to be a factor later this year.
I arrive at this conclusion by looking at symptoms in total. Let's take a look at the traditional safe haven in times of inflation, GOLD and SILVER. The precious metal has been on a tear, of late, currently trading over $980 per ounce. In May, silver rose 22%, it's largest one month gain ever. Black Gold, otherwise known as crude oil is also on a tear having closed at $66.31 on Friday, which is the 2009 closing high as well as its highest level since November 2008.
As it turns out, you would think the global economies must be expanding at a singing pace as not only precious metals and oil are rallying but other commodities as well. In fact, while price concessions have been wrung out of metallurgical coal producers shipping coal to China for steel production within the last two weeks, steel stocks are now being bought up like they are going out of style.
Taking a look at the American Exchange's Gold Bugs Index (A collection of 15 gold mining stocks that don't hedge their gold prices more than 18 months in the future) we see that the index bottomed at the first equity market bottom last October.
CHART OF HUI
Since last October, the Gold Bugs Index has moved consistently higher, pulling back when the equities markets moved to new lows, but never retesting its lows of around 150. The Gold Bugs Index is currently near 400 supporting gains of over 165% since October! As the chart comments, RSI (Relative Strength Index) is over 70 and a reversal here means that technical traders will begin to short the mining stocks within the index.
For the purposes of inflation, a move this large for the mining stocks is quite exaggerated but suggests that inflation worries may continue to drive up the price of the precious metal.
We can also look at inflation adjusted treasuries and see that they continue to rise in value but have pulled back for two months and have also paid dividends over the last two months as well with another due in early June. The value of the inflation adjusted treasuries is determined by the market while the dividends are determined by inflation. Since these securities are currently paying monthly dividends, it is safe to say that inflation is currently a factor now, not in a few years as the Fed has suggested it would be.
The effect of rampant U.S. government spending has cause the value of the dollar to reach its low of the year with the attendant rise in the price of commodities. This is already being manifested as inflation and the Fed is between a rock and a hard place as they try to support growth in the economy while warding off inflation. They can not afford to let the nascent economic recovery collapse, even before there are signs of expansion, rather than merely signs that the contraction has slowed. They can not, therefore, combat inflation at this time and it could turn into another 1970s double digit inflation scenario, one in which fixed income investors will grit their teeth as bond prices fall through the floor as interest rates eventually rise to combat the runaway inflation.
Want to save $$?
Change to an annual subscription and save 20% off the monthly subscription price!
Market Outlook and Conclusion
On Friday, the TED Spread closed at 0.526. The "normal" range for the TED Spread is 0.10 to 0.50, so it is just above that level and moved up four points over the course of the week. We will continue to monitor this but may not choose to report on it if it continues to maintain its current range.
Recall that the TED Spread is the difference in interest rates between 3-month (T)reasuries and 3-month LIBOR rates. LIBOR is the London Inter Bank Offered Rate denominated in (E)uro (D)ollars.
This week, we will share some weekly charts with you to provide a back drop of market behavior since the 1990s rise and subsequent collapse of the market in 2000. We find that an Epic Battle between the Bulls and the Bears is in the wings with a serious clash coming up perhaps in the coming week.
As I have been repeating every week, the market pundits who continue to claim the sell-off wasn't done and we are headed for the bottom have been wrong. With that said, after the markets establish news highs I believe we will see such a pull back. This is something I have been repeating over and over as something of a lone voice in the wilderness. Last week, I alluded to one market prognosticator that was bearish but hadn't yet detected an opportunity to short the market. I am not sure if/when he will make a call to short the market but I feel it is a good time to lock in some of your gains or to take action to protect your long positions.
While I am not ready to aggressively short the market yet, I am near that point, even if the short trade might not last a long time. I am waiting for the bears to battle with the bulls as the Dow and S&P-500 cross the 200-Day Moving Average (DMA).
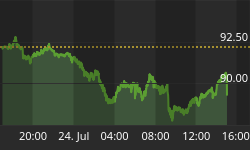
Just before we look at the charts, let's take a look at the price of oil and the yield on the 10-Year Note. The price of a barrel of oil in the near term futures market moved up to $66.31, which is a gain of nearly five dollars in a single week. Last week, the yield for the 10-year note moved up and down twenty points on different days but ended the week having risen two basis points to close at 3.47%.
I won't bother to share the implied volatility charts with you. Suffice it to say that they continue to move lower as the NASDAQ-100 and S&P-500 move higher. Recall that we have repeatedly been suggesting that this trend will change and provided a week-by-week countdown of the expected rally in volatility. Well, the time is up and we expect a change in the coming week.
We will now take a look at the Philadelphia Semiconductor index (SOX).

Last week we suggested the rally would continue as the 50-DMA (yellow line) moved up through the 200-DMA (red line). This occurred and the SOX is making new highs.
I believe, however, that that trend is likely to come to an abrupt halt and a reversal is likely shortly. The break-out traders will all be entering the equities markets now but we believe that many bears will now move from the sidelines to prevent an advance. That attack is likely to occur in the coming week.
Last week, we suggested that the NASDAQ Composite would finally break above the 200-DMA and it did. We can take a look at the NASDAQ Composite with a weekly chart going back to the time of the market slide from 2000. The rally that began in March this year could continue as it did from March 2003 to January 2004. The precursor to the March 2003 rally was a bottom in October 2002 with a top in early December 2002 before a successful retest led to the rally that lasted from March 2003. We believe that a similar move is likely shortly, rather than a continued rally here.

Let's take a look at the Dow Jones Industrial Average (DJIA) on a weekly chart since 1999.

The battlefield for the broader market is clearly drawn. The bulls are ready to assault the 200-DMA but we believe the bears will wait to strike until the DJIA has reached its upper Bollinger Band. At that time, subject to our indicators confirmation, we believe that you can successfully short the major indexes or stocks for whatever period the bears are successful at causing a retest. As I have repeatedly stated, I don't believe this retest will reach the lows set in early March but it should serve to shake out the rest of the weak bull hands.
Taking a look at the S&P-500 weekly chart over the last few years shows how close the bulls have pushed the S&P-500 to the 200-DMA. A clash is likely between bulls and bears at the upper Bollinger Band. Just as the longer term chart for the DJIA illustrated, a reversal at that point is likely.

We believe that you can use this bull/bear clash to your advantage. To see how we will play this actively, you should consider a subscription to the McMillan Portfolio.
Our long term portfolio currently holds an average gain of over 53% per closed position. Our unrealized gains on open positions are at 97.1% and we have ample cash to enter new long-term positions as well as short/intermediate term positions.
I hope you have enjoyed this weekly article. You may send comments to mark@stockbarometer.com. Please don't be shy in expressing your opinions of what you would like to see covered.
A subscription to this service is only $8.95/month. To receive a 20% discount on the subscription price, an annual subscription is available by clicking here.


