


Market Wrap
Week Ending 6/19/09
State of the Nation
From 2005 to 2009, the U.S. debt has increased $14 trillion dollars, while GDP went up a bit less than $2 trillion. It now takes over $7 dollars of new debt to "create" $1 of GDP "growth". In 2006 the ratio was less than $5 dollars. Soon, it will be double that amount.
This is not a good thing; nor is it sustainable. It is a path to bankruptcy, ruin, and utter despair. It is a national disgrace. A free people should not accept the unacceptable. The Declaration of Independence explains it very simply in straightforward language that covers ALL particulars.
The government and Federal Reserve have committed about $12.8 trillion to restart the credit markets and end the longest economic slump since the 1930s. The bond market is responding accordingly - rates are rising and prices are falling. This is a thumbs down vote of no confidence to the Fed, as it should be.
The difference between the yields on 10-year Treasuries and the year-over-year consumer price index, known as real yields, is near 5 percent, the widest spread since 1994. The wider the spread, the more investors are worried that all the various bailout schemes are going to lead to inflation.
Higher real rates are bullish for gold, as it means the dollar is being debased (losing purchasing power). We are losing wealth. The standard of living is falling.
Do not listen to what they say - watch what they do. Talking heads spin the news to suit their master's intent.
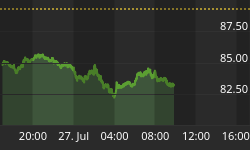
The chart below clearly shows the sharp drop in T-bond prices since Jan. 2009. A small rally has been underway since the middle of June.
If stocks continue to correct, bond prices will most likely rally, as money moves from stocks to oversold T-bonds.
I look for higher bond yields (lower prices) further down the road. Eventually, bonds, the dollar and stocks will fall in unison, as the bear digs its claws in deep.
The carnage will not be pretty. All we want to do is get out of its way - unscathed.

Senator Richard Shelby of Alabama was right on when he replied to Geitner's scheme for more central bank power and authority, saying that the Fed had:
"Utterly failed the American people as a regulator" and that "now you want to pile more and more responsibility on them? We better not do this."
I agree with Congressman Ron Paul - I don't even see where the Constitution grants any authority to the Federal Reserve. Quo Warranto. Audit the Federal Reserve: HR 1207 and S 604 | Ron Paul .com
Silver
Silver had another tough week, losing over 4%. This puts its three week loss at about 9%, compared to gold's 4.7% (a little over half as much).
But silver has outperformed gold since the Oct. lows, however, it fell much more from the March 2008 highs. Silver is much more volatile than gold; and will likely gain more percentage wise.
The daily chart of SLV (second chart below) shows many interesting details. The blue horizontal line is resistance turned to support. Note the 50% fib level is close by, as is the 50 ma.
CCI has fallen from overbought to oversold readings. Worthy of special attention is STO. Notice how in the past it put in double bottoms below 20 - meaning the first crossover was false.
Will it happen again? MACD gives a more reliable signal. The first chart (gold/silver ratio) suggests higher prices.


Gold Stocks
Precious metal stocks, as represented by the GDX chart below, lost 3% for the week. Note they gained 3% of Friday, meaning they had been down 6% intra-week. Many are not going to like what I have to say, but it's the truth as of now, so here it is.
The pm stocks have had a huge rally out of the Oct. 2008 lows, rallying from 15.83 to 45.10 for an incredible 184% gain. That's smoking in anyone's book. But that may be the problem. Here's why.
That is a monstrous rise in any reasonable timeframe, let alone in 8 months. Since April (2 months) the index has rallied 40%. This may all be too much, too soon. These gains are going to need to be digested.
In 2006 gold was around $500 and is now approaching $1000, while the pm stocks languish. In other words, in the time that gold has doubled in price, the gold stocks have gone nowhere.
Regardless of what ANYONE says, pm stocks have and are underperforming physical. This may give them reason to rally a greater percentage, then again it may not.

Next up is a different view of the daily GDX chart, which goes back to July of 2008. There is a very interesting, and perhaps important, observation to note.
The vertical lines on the chart connect the various indicators with bottoms in price. Notice that STO made double lows several times in succession BEFORE putting in a sustainable rally.
MACD did the same most of the time as well. Will it happen again, as price is now at the 20 STO oversold level and curling up?
If the overall stock market continues to correct, this would likely put pressure on the pm stocks. Attention is warranted.

Stock Watch List
In lieu of the above comments on the pm stocks in general, I thought it would be good to examine the performance of various pm stocks to the price of gold.
There are several gold stocks that performed MUCH better than the GDX did versus gold. I could not find one major silver stock that did so versus silver.
This suggests two things:
- Physical gold & silver have a better risk to reward ratio than stocks. I have recommended a good way to safely play this theme.
- Only the gold stocks that have kept up with gold should be considered for purchase. The stocks listed on the stock watch list meet these criteria.
The latest full-length version of this week's market wrap is available only on the Honest Money Gold & Silver Report website. All major markets are covered with the emphasis on the precious metals. Stop by and check out our comments on gold's potential profits and a list of the gold stocks that have outperformed the GDX by wide margins.
We are so bullish on gold we are offering a money back guarantee if gold does not make a new high during 2009. A free trial subscription is also available. A copy of the new book: Honest Money is FREE with every new subscription.
Good luck. Good trading. Good health, and that's a wrap.

Come visit our website: Honest Money Gold & Silver Report
New Book Now Available - Honest Money


