


Technical Observations
The past two weeks have brought about the anticipated trading range in gold:
• We lowered our resistance target to $406 to $409 two weeksago and the rally of the past week was capped nicely at $406.30.
• The support at the 150-day moving average ($389) was testedon March 3rd. This coincided with the US Dollar rally to our minimum target ofthe 20-week exponential moving average.
We should be within 10 trading days of breaking out of this range.

00's
On January 17th we put out a report on the historical volatility seen as prices moved through the 00's (ie. $200, $300, $400 etc.). The normal price action is an overbought RSI reading of 75 to 81 followed by a correction of one month or more, bringing prices back to the 150-day moving average (233-day is allowable) and generating a 40-point break in the RSI. Once this is in place the market is free to challenge the highs. This time the RSI peaked at 75 and only dropped by 38 points, however the other two criteria are now in place.
The following charts show the examples where gold moved through 00, became overbought and then corrected. The arrows present the positioning as we identify it now.
Newmont Mining is also shown as our long-standing proxy for analysis of mature mining stocks. The analysis starting in mid December called for purchases on a correction to anticipated support at $41.70 with a 5% stop loss. We can see how well this level has held even as the price of bullion has continued to give up ground. When reviewing the following charts it is evident that we are within two weeks of where upside movement should be re-established. The marginally higher lows of the past two weeks ($41.08) should hold in order to keep this positive conclusion in tact.

Commitment of Traders
COT data (conveniently compiled as of the high close on March 9th) continues to be unsupportive for now. Once again the net long speculative non-commercial positions made a lower high and the net short commercial position required a smaller degree of selling to cap the rally. Until we have a catalyst to change this we continue to view $406 to $409 as an important resistance. Another failed attempt to breakout over the next ten days will likely result in a break to $370. A close of $410 will be considered a breakout.

US Dollar
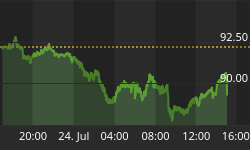
The weekly oversold reading in the US Dollar in January resulted in a sell signal for gold. The subsequent close back above the 50-day ema on February 26th alleviated enough of the oversold condition to provide a low for mining stocks. This technique worked well coming off three important lows in the stocks since 2001 (8/16/02, 3/14/03 & 6/27/03). It also shows up five times from 1986 through 1999. As long as the US Dollar remains below its 50-week ema (92.62) the chances of a significant decline in gold and mining shares is minimal.

However, any close above both the average and the March 3rd high of 89.84 in the coming months would remove an underpinning for this sector and produce immediate selling pressure. Once the initial selling pressure abates then we could enter a phase where foreign buying of gold would outweigh the currency effect and the two would rise together. While gold does best when the US Dollar is declining, there are many instances when it has advanced for three to five month stretches in unison with the dollar.


