


Summary of Index Daily Closings for Week Ending Mar 19, 2004
| Date | DJIA | Transports | S&P | NASDAQ | Jun 30 Yr Treas Bonds |
| Mar 15 | 10102.89 | 2790.30 | 1104.41 | 1939.29 | 114^30 |
| Mar 16 | 10184.67 | 2788.30 | 1110.71 | 1943.08 | 115^30 |
| Mar 17 | 10300.30 | 2847.65 | 1123.77 | 1976.76 | 115^31 |
| Mar 18 | 10295.57 | 2830.92 | 1122.31 | 1962.44 | 115^10 |
| Mar 19 | 10186.60 | 2786.83 | 1109.74 | 1940.47 | 114^29 |
| SHORT TERM FORECAST (Next Two Weeks) | ||||
| TREND | PROBABILITY | Legend | ||
| Substantial Rise | Low | |||
| Market Rise | Medium | Very High | 80% | |
| Sideways | Medium | High | 60% | |
| Market Decline | High | Medium | 40% | |
| Substantial Decline | Medium | Low | 20% | |
| Very Low Under | 20% | |||
| INTERMEDIATE TERM FORECAST (Next 12 Weeks) | ||||
| TREND | PROBABILITY | Substantial | 800 points+ (DJIA) | |
| Substantial Rise | Low | Market Move | 200 to 800 points (DJIA) | |
| Market Rise | Medium | Sideways | Up or Down 200 (DJIA) | |
| Sideways | Medium | |||
| Market Decline | High | |||
| Substantial Decline | Very High | |||
This week the Dow Jones Industrial Average declined 53.48 points to close the week at 10,186.60, in line with last weeks Short-term Technical Indicator Index reading of minus (9.00). The sharp declines Monday and Friday were on increasing volume - "distribution days" in both the NYSE and the NASDAQ. The strong rally days on Tuesday and Wednesday in the NYSE, and on Wednesday in the NASDAQ were on shrinking volume. Daily "new 52 week high" tops have been declining steadily since December 2003, from the 600s to the 100s, while the number of new lows have recently been starting to rise. All the major averages are now down for the year.
We remain under a Dow Theory "sell signal," insiders are dumping shares like water from a sinking schooner, the ten week cycle turned down a week early and remains down until mid-April, most averages have broken decisively below their 50 day moving average support levels, and most stock indices are forming highly reliable topping patterns. Let's take a look.
| Equities Markets Technical Indicator Index (TII) ™ | ||||
| Week Ended | Short Term Index | Intermediate Term Index | ||
| Nov 7, 2003 | 0.50 | (53.47) | Scale | |
| Nov 14, 2003 | (42.75) | (52.33) | ||
| Nov 21, 2003 | 0.38 | (51.90) | (100) to +100 | |
| Dec 5, 2003 | (31.75) | (55.18) | ||
| Dec 12, 2003 | (5.83) | (54.43) | Negative (Bearish) | |
| Dec 19, 2003 | (6.50) | (47.03) | Positive (Bullish) | |
| Jan 2, 2004 | (48.17) | (40.33) | ||
| Jan 9, 2004 | (96.50) | (39.28) | ||
| Jan 16, 2004 | (20.00) | (40.65) | ||
| Jan 23, 2004 | (8.13) | (32.15) | ||
| Jan 30, 2004 | 2.81 | (25.98) | ||
| Feb 6, 2004 | 11.75 | (20.19) | ||
| Feb 13, 2004 | (68.25) | (22.19) | ||
| Feb 20, 2004 | (30.00) | (22.36) | ||
| Feb 27, 2004 | (31.00) | (20.17) | ||
| Mar 5, 2004 | 16.00 | (17.17) | ||
| Mar 12, 2004 | ( 9.00) | (14.70) | ||
| Mar 19, 2004 | (12.00) | (27.60) | ||
This week the Short-term Technical Indicator Index comes in at negative (12.00), meaning we can expect the equity market to move down again next week. This indicator is a useful predictor of equity market moves over the next two weeks, both as to direction and to a lesser extent strength of move. For example, readings near zero indicate narrow sideways moves are probable. Readings closer to +/-100 indicate with a higher degree of confidence that an impulsive move up or down is likely over the short run.
The Intermediate-term Technical Indicator Index is useful for monitoring what's over the horizon - over the next twelve weeks. It serves as an early warning system for unforeseen trend changes of considerable magnitude. This week the Intermediate-term TII comes in at negative (27.60), warning that a significant reversal remains at risk over the next three months. This indicator worsened substantially this week, reflecting the deteriorating technical landscape. It will take massive increases in M-3 to mitigate the damage or the timing, which so far on an intermediate-term basis does not seem to be occurring.
The big question hanging out there for the Bears is how far can this first leg down go before markets attempt to shake off this decline as simply another normal correction in a powerful rising longterm Bull market? With prices breaking decisively below their 50 day moving averages on most indices, we can establish some clear cut probabilities for future price movement. Whereas the 50 day MA had been support for the averages (see the following charts and note how many times prices kissed but failed to break below the 50 day MA during the March 03 to March 04 rally), now the 50 day MA represents formidable resistance. The stock indices will attempt to better this new resistance level before turning down in earnest. In fact, we've been seeing upward movement toward the 50 day MA the past four days. So far the 50 day has held up. Likely next will be a bounce off the underbelly of the 50 day MA, and a break down toward the 200 day moving average. The 200 day MA represents the next key support level and investors should expect a test of this area over the next several weeks.

The above chart shows that over the past five years, nearly every time prices crossed decisively above/below their 50 day moving average - that is by more than 1.5% - prices continued to at least within 1.0% of their 200 day moving average. Since the year 2000, there were 26 instances where prices moved more than 1.5% across their 50 day MA. In 24 of those instances, prices continued on to within 1.0 percent of their 200 day moving average. Only once did they fail to extend at least that far. The 26th instance is the situation we are experiencing now. Most 1.5% moves past the 50 day MA took less than one week to reach their 200 day MA. Only twice did the move take longer, one time taking 20 trading days, the other 58 trading days. The point is, the 200 day is the next landing strip for prices once they take off from the 50 day MA's runway . . . and it's a puddle jump.
If the 200 day MA is a ninety-percent-plus probability short-term price target, the next question is, what is the probability that prices blow through their 200 day MA and keep on going, versus reversing? Of the 24 observances where prices blew past their 50 day MA and landed within 1.0% of their 200 day MA, there were only 4 occasions when prices reversed. Over eighty percent of the time, prices extended more than 1.5 percent beyond their 200 day. The time for these extended moves to start ranged up to 28 trading days later with most incidences occurring within a week.
Thus the odds are quite low that prices return above their 50 day MA before hitting or crossing below their 200 day moving average. Expect the DJIA to decline to the 9800 to 10,000 area at least once before a strong rally toward 10,500ish unfolds. They may rise a bit further from here, but there is strong resistance at 10350. Failing to plow above this level should turn indices down with momentum.


There are a number of significant, high probability topping patterns nearing completion in the various stock indices.
The blue chart on page 3 identifies a good-looking Bearish Head and Shoulders pattern in the Dow Transportation Average. What's particularly interesting about this chart is that there is a convergence of three data lines: two strong support levels - the 200 Day MA and the neckline of the Head and Shoulders pattern - and recent price action. In fact the Trannies sit a mere 2 points away from their 200 day. By my count there are at least four other equity averages completing Bearish Head and Shoulders patterns: The NASDAQ Composite ($COMPX), the NASDAQ 100 ($NDX), the PHLX Semiconductor Index ($SOX), and the AMEX ($XAX). Completion of these patterns will be confirmed once prices fall below necklines. Minimum downside targets can be measured by taking the difference between the top of the head, and the neckline, then subtracting that distance from the neckline. These are minimum decline projections.
The Wilshire 5000 ($TMW), the S&P 500 ($INX), and the Russell 2000 ($IUX) have all formed Bearish Triple Top patterns. They have attempted to reach a new high two more times after reaching their rally highs, failing to better those highs, thus establishing a ceiling by essentially equaling them.
To sum up, the technical landscape is looking more and more ominous as price patterns weigh in on the growing body of Bearish evidence. It will take an M-3 miracle to postpone a 2004 equity slide of considerable magnitude.
The Economy:
The Federal Reserve reported this week that Industrial Production rose 0.7 percent in February while Capacity Utilization still lagged at a 76.6 percent clip. The New York Fed added that Manufacturing Activity in the Empire State plunged to 25.3 in March from 42 in February.
The Federal Reserve Open Market Committee announced on Tuesday that it would hold short-term interest rates at 46 year lows, targeting a 1.0 percent Federal Funds Rate, the rate banks loan each other overnight money. This influences key business and consumer interest rates, especially those tied to Prime. The Mortgage Bankers Association reported that Mortgage Refinancing Applications soared 40 percent for the week ended March 12th, 2004. This reflects the recent rally in the Bond market which has once again pushed long-term interest rates down.
In the face of lower long-term interest rates and historic low short-term interest rates, both the Consumer Price Index and the Producer Price Index measures indicated inflation is on the mild rise. The Labor Department reported that the CPI rose 0.3 percent, 0.2 percent if food and energy are excluded, and the PPI - a measure of wholesale prices - rose 0.6 percent, 0.3 percent if food and energy are excluded.
Housing Starts fell 4 percent in February after falling 6.3 percent in January according to the Commerce Department. This segment of the economy has been a key catalyst for economic expansion according to the Master Planner's blueprint, so this decline may help explain why in the face of a socalled recovery, interest rates aren't budging. This and the moribund job picture.
Jobless Claims came in last week at 336,000 according to the Labor Department, about the same as it has been for weeks now. It remains a big number - far too big - for this stage of a supposed recovery. The latest company to wield a sharp axe is Bank of America, announcing it will cut 13,000 jobs. With Asian skilled-worker wages a fifth of what American wages pay for similar work, look for the continued exodus of U.S. jobs overseas. The Master Planners can talk "retraining" all they want, but where's the steak? Where's the corporate hiring and training tax breaks? Where's the infrastructure job-creating government projects? Where's the income-averaging tax breaks when displaced workers' severances run out? Where's the extended unemployment benefits that would allow time for retraining? The answer is, with record busting federal deficits, these programs simply add to the budget imbalance, thus so far have been ignored.
So is it any wonder that Consumer Confidence continues its decline? The ABC/Money magazine Consumer Comfort Index fell to minus (-) 22 for the week ended March 14th. This compares to a minus (-) 3 rating only a few months ago. Keep in mind there appears to be a pretty strong direct correlation between Consumer Confidence and the Equity averages.
Money Supply, The Dollar, & Gold:
Money Supply as measured by M-3, one of the broadest measures, changed direction and fell $9.6 billion for the week of March 8th, 2004. It had risen sharply since the first of the year. While one week does not a trend make, we must keep an eye on this figure because as has been demonstrated in past issues of this newsletter, there is a strong direct correlation between M-3 and the price movement of the Equity averages. If we take an intermediate view of M-3 (more than a month, but less than a year), we find that M-3 is up very little since September, up $45.5 billion in six months, an annualized growth rate of about 1.0 percent - historically quite low, and not conducive to supporting robust economic growth. In our September 26th 2003 newsletter, issue number 16 (available in the archives section at www.technicalindicatorindex.com), we noted that when M-3 rose, the Dow Jones Industrial Average rose, and when M-3 fell or plateaued, stocks declined. Essentially M-3 has plateaued for the past six months. Since the length of this plateau has been rather long, it could portend not just an equity market decline, but a coming decline that is deeper than most good folks expect.
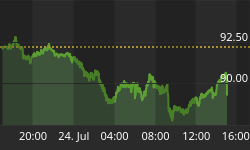
The U.S. Dollar spent most of the week knocking at 90's doorstep, but unable to come in. If M-3 doesn't continue its meteoric rise of the past decade, the dollar should rally and maybe even head for 100. While popular economic thought expects the dollar to crash and bonds to plummet, if M-3 can't pick up some steam, deflation will become a more likely scenario than inflation. The Fed recognizes this which is why during a week that inflation figures picked up, they kept rates low. They comment about laggard jobs growth. True. But the problem is bigger than jobs. Deflation. Deflation is the greater danger by far to our economy than inflation, and the Fed is right about this. They dismiss it as not much of a threat, in fact refuse to say the word, referring instead to "disinflation," however their actions speak volumes. Why isn't M-3 growing? You gotta believe the Master Planners want M- 3 to grow. Perhaps consumer and business borrowers are tapped out. It is the bank lending function which largely creates money. If no lending, not much M-3 growth. With debt levels at historic highs, with job growth pitiful for an expansion, monetary stimulus may be starting to fail. How do you get overextended debtors to borrow more, especially when fear of job loss occupies many minds, as evidenced in the declining confidence figures? Rates are already about as low as they can go. Now what does the Fed do? What if at some point people perceive that the Fed is losing its grip, that they are not the all-powerful, all-knowing economic prosperity provider? Will investors listen when they are told to pay no attention to that man behind the curtain? Can you just imagine the fear that might hit the markets should the Fed's monetary policy be perceived as ineffectual? Scary times.
Which is why Gold makes sense . . . which is why Gold prices should rise. Technically, gold appears to have formed a Bullish Head & Shoulders bottom. As mentioned here in past issues, it's hard to figure how you can lose by holding gold over the long run. If inflation kicks in as a result of huge increases in M-3 over the past decade, as a commodity, gold should increase in value. Should deflation strike, gold has historic intrinsic value as a medium of exchange. That value should only increase as fiat currencies seek renewed credibility. All it would take would be for one major currency to adopt gold backing to create hyper-demand for the metal.
Bonds and Interest rates:
The Fed spoke loud and strong this week. Short-term interest rates are staying down. Period. If our economy is as strong as they claim, if inflation is truly beginning to return, then the Fed has no business leaving short rates at 1.0 percent. Something doesn't wash here. That something is that deflation is real and at high risk of returning. It may be a catch twenty-two. If the Fed were to raise rates, asset prices in housing and equity markets and bond markets would decline, ergo, deflate. The economy is simply too fragile. As long as short-rate policy calls for low rates, expect long-term rates to follow. The Fed can control both, and they've already told us they will if they have to. After all, there is a heavyweight election fight on the November card. A real donnybrook. One caveat - yields on ten year notes have formed a classic Bullish flag pattern, meaning interest rates should rise and notes prices should decline. Does this mean Japan is about to stop buying our Treasuries? I don't believe the Fed will let long rates fall at this time, and will trump technical analysis here. Isn't manipulation, er, ahem, management a beautiful thing?
Bottom Line:
We believe most equity indices will decline to test their 200 day moving averages sometime over the next three weeks. The Trannies already have. While the averages may break through, there is a good probability that a significant short-covering rally will kick in first and send prices back up, take one more crack at breaking above their 50 day moving averages. We believe the 50 day resistance level will hold, and by doing so create fear that touches off major selling, driving prices decisively below their 200 day moving averages - a surprise sell off since this is an election year. Remember, equities discount the future so all the negative expectations for after the election will likely be recognized by the markets beforehand. The Fed will do everything it can to stop the bleeding, but with interest rates already at 46 year lows, a lot of the ammo has already been spent. Not to fear, at some point prices will find value buyers, probably before the autumn for a nice pre-election rally. The Bear is about to return and he's famished. If we liken technical analysis to the time when Noah was building his ark, it's safe to say it is now raining. Extreme caution is warranted.
"Oh God, who is like Thee?
Thou Who hast shown me many troubles and distresses,
Will revive me again,
And will bring me up again from the depths of the earth."
Psalm 71: 19,20
| Key Economic Statistics | ||||||||
| Date | VIX | Mar. U.S. $ | Euro | CRB | Gold | Silver | Crude Oil | 1 Week Avg. M-3 |
| 10/17/03 | 17.62 | 92.61 | 116.33 | 242.00 | 372.2 | 4.94 | 30.70 | 8903.5 b |
| 10/24/03 | 17.70 | 91.46 | 118.04 | 249.50 | 389.2 | 5.16 | 30.16 | 8892.7 b |
| 10/31/03 | 16.00 | 92.98 | 115.57 | 247.00 | 384.6 | 5.06 | 29.11 | 8876.5 b |
| 11/07/03 | 16.84 | 93.20 | 115.11 | 249.75 | 383.4 | 5.05 | 30.85 | 8876.8 b |
| 11/14/03 | 17.33 | 91.58 | 117.60 | 256.25 | 398.0 | 5.41 | 32.37 | 8860.6 b |
| 11/21/03 | 18.98 | 90.72 | 119.09 | 250.50 | 396.0 | 5.29 | 31.61 | 8851.4 b |
| 11/28/03 | 16.32 | 90.28 | 119.65 | 253.25 | 398.0 | 5.39 | 29.96 | 8850.0 b |
| 12/05/03 | 17.23 | 89.17 | 121.60 | 256.00 | 407.3 | 5.49 | 30.73 | 8807.8 b |
| 12/12/03 | 16.46 | 88.44 | 122.74 | 261.75 | 410.1 | 5.64 | 33.04 | 8812.9 b |
| 12/19/03 | 15.71 | 88.53 | 123.58 | 259.50 | 409.9 | 5.72 | 33.02 | 8807.2 b |
| 1/02/04 | 18.30 | 86.93 | 125.76 | 256.75 | 416.1 | 5.96 | 32.52 | 8819.7 b |
| 1/09/04 | 16.79 | 85.40 | 128.19 | 266.50 | 426.8 | 6.49 | 34.31 | 8828.4 b |
| 1/16/04 | 14.98 | 88.05 | 123.57 | 265.50 | 407.0 | 6.33 | 34.00 | 8849.4 b |
| 1/23/04 | 14.88 | 88.81 | 125.81 | 266.50 | 408.0 | 6.36 | 34.94 | 8864.4 b |
| 1/30/04 | 16.46 | 87.48 | 124.42 | 262.10 | 402.9 | 6.25 | 33.05 | 8895.2 b |
| 2/06/04 | 16.00 | 86.15 | 126.83 | 260.50 | 403.6 | 6.27 | 32.43 | 8884.8 b |
| 2/13/04 | 15.62 | 85.68 | 127.25 | 264.85 | 410.8 | 6.58 | 34.56 | 8895.4 b |
| 2/20/04 | 16.05 | 87.40 | 126.96 | 264.50 | 397.5 | 6.53 | 34.25 | 8932.1 b |
| 2/27/04 | 14.53 | 87.89 | 124.52 | 273.90 | 396.8 | 6.71 | 36.16 | 8946.5 b |
| 3/05/04 | 14.52 | 88.75 | 123.28 | 274.00 | 401.6 | 6.99 | 37.26 | 8956.2 b |
| 3/12/04 | 18.21 | 89.60 | 121.80 | 272.00 | 395.6 | 7.06 | 36.19 | 8946.6 b |
| 3/19/04 | 19.15 | 88.56 | 122.47 | 280.20 | 412.7 | 7.56 | 37.62 | - |
Note: New highs in the VIX, the CRB index, Silver, and Crude Oil.
The Passion of The Christ is now playing in your local theater
Go to www.thepassionofthechrist.com for more information.


