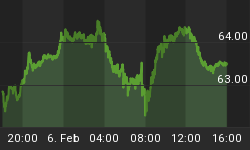
Inflowing Liquidity ... it is a prime necessity for rallies.
Outflowing Liquidity ... it is what happens when you get a pull back or correction.
Today's chart is presented as a courtesy to our free members.
Here is the explanation of the chart ....
There are only two Major conditions for Liquidity flows. They are either in expansion or contraction. During Liquidity Expansion, the inflows exceed all the outflows and net positive money is entering the stock market. That means that, not only are people buying, but they are also hesitating to sell because they do not want to miss out on perceived, additional action to the upside.
Liquidity Contraction is just the opposite. Outflows exceed all the inflows and net negative money is leaving the stock market. That means that ... not only are people selling, but they are hesitating to buy because they do not want to get hurt again on perceived, additional action to the downside.
So, let's look at the chart now to see what is happening now. First, note that Liquidity levels are now back into Expansion and in fact, Liquidity inflows hit an expansion level in April.
By the beginning of May, Inflowing Liquidity was hitting some pretty high levels. It quieted down for a few weeks at the end of June and beginning of July ... and then broke a resistance line to the upside and shot up on July 15th. ... and up with it, went the market.
As of yesterday, inflowing liquidity levels were still high and strong so investors are still chasing stocks right now.


