


Risky assets last week again marched higher to the tune of economic data supporting the argument of a global economic recovery. A realization among investors that the economic transition from recession to recovery was gaining momentum resulted in many global stock markets and commodities scaling fresh peaks for the year.

Source: Steve Breen
The S&P 500 Index closed the week above the psychological 1,000 level, marking its highest level since November and capping four consecutive weeks of gains. And more upside lies ahead, said Abby Joseph Cohen, Goldman Sachs' market strategist, who expects the Index to reach the 1,100 point by year end. (Is this a contrary indicator coming from a permabull?)
Many commodities such as crude oil, copper, aluminum, nickel, lead and zinc hit their highest levels of the year, not to mention sugar recording a 28-year peak. "The financial crisis has been addressed, the commodity crisis has not," warned Goldman Sachs (via the Financial Times), predicting that this year's rise in prices was "just the beginning" of another rally that was "ultimately likely to be even more extreme" than those seen in the past. However, the Baltic Dry Index - a measure of freight rates for iron ore and bulk commodities that correlates very well with base metal indices - has broken technical support on the downside and short-term weakness in metals prices looks likely, possibly as a result of the Chinese buying frenzy having come to an end.
While high-yielding commodity-linked and emerging-market currencies were in favor, the US greenback dropped to its weakest level since October before staging a rally on Friday after the announcement of the US employment data had pleased some traders (see comments in the "Economy" section below). Government bonds (with the exception of emerging markets) again sold off as the bond vigilantes cottoned on to the improved economic outlook.
The past week's performance of the major asset classes is summarized by the chart below - a set of numbers that indicates continued investor appetite for risky assets (albeit with investment-grade and high-yield corporate bonds taking a breather).

Source: StockCharts.com
A summary of the movements of major global stock markets for the past week, as well as various other measurement periods, is given in the table below.
The MSCI World Index (+1.8%) and MSCI Emerging Markets Index (+1.1%) both made headway last week to take the year-to-date gains to +15.5% and an impressive +50.4% respectively. The US and other markets extended their rallies to four straight weeks in most instances, although some weakness crept in among developing countries such as China, India, Singapore and Taiwan. It is also noteworthy that emerging markets underperformed developed markets for the first time since the beginning of May. Could this be a first sign of a retrenchment in risk appetite?
Click here or on the table below for a larger image.

Stock market returns for the week ranged from top performers such as Bulgaria (+15.5%), Romania (+8.3%), Lithuania (+8.2%), Kazakhstan (+8.1%), Estonia (+8.0%) and the Czech Republic (+7.1%). These are all Eastern Europe countries playing catch-up as pundits came to the conclusion that the initial doomsday scenario for the region's debt situation was not as bad as predicted. At the bottom end of the performance ranking, countries included Malta (?5.8%), China (-4.4%), Singapore (-4.1%), Côte d'Ivoire (-3.9%), Greece (?3.6%) and India (-3.3%).
After almost doubling since the beginning of the year and notching up seven straight weeks of gains, the Chinese Shanghai Composite Index declined by 4.4% last week - its worst performance for five weeks. The Index has broken its first level of support and it would not come as a surprise if lower Chinese equities serve as the catalyst for a pullback in global stock markets.

Source: I-Net Bridge
Of the 96 stock markets I keep on my radar screen, a majority of 74% (last week: 74%) recorded gains, 21% showed losses and 5% remained unchanged. (Click here to access a complete list of global stock market movements, as supplied by Emerginvest.)
John Nyaradi (Wall Street Sector Selector) reports that as far as exchange-traded funds (ETFs) are concerned, the winners for the week were dominated by real estate funds, including iShares FTSE NAREIT Industrial/Office (FIO) (+19.0%), Cohen & Steers Realty Majors Index (ICF) (+17.8%) and SPDR DJ REIT Index (RWR) (+17.1%).
On the losing side of the slate, ETFs included ProShares Short Financials (SEF) (-10.2%), Vanguard Extended Duration Treasury (EDV) (-6.7%) and iShares Lehman 20-year Treasury Bond (TLT) (-4.6%). As a sector, biotechnology fared badly, as seen from the performance of iShares Nasdaq Biotechnology (IBB) (-3.5%).
As far as the credit markets are concerned, after having peaked at 4.82% on October 10, the three-month dollar LIBOR rate declined to a record low of 0.46% last week. LIBOR is therefore trading at 21 basis points above the upper band of the Fed's target range - almost back to normal when compared to an average of 12 basis points in the year before the start of the credit crisis in August 2007.
The TED spread (i.e. three-month dollar LIBOR less three-month Treasury Bills) is a measure of perceived credit risk in the economy. Since the peak of the TED spread at 4.65% on October 10, the measure has declined to a 14-month low of 0.29% - a vast improvement and now actually below the 38-point average during the 12 months prior to the start of the crisis.

Source: Fullermoney.com
Still on credit, Floyd Norris said on his blog in The New York Times: "It is with a great sense of joy that I read today that Donald Trump is almost back in the casino business. So why do I feel joy at the news? If a casino company run by Mr. Trump can get credit, then the credit crunch must surely be over."
The quote du jour this week concerns the US dollar and again comes from Richard Russell (Dow Theory Letters). He said: "Build a brick house. Then pull the bottom row of bricks out of the house, and what have you got? A wobbly wreck. The dollar is comparable to the bottom row of bricks in the US economy. Everything in this fair land from houses to stocks and bonds is denominated in dollars. But now the dollar is weak.
"The US Dollar Index is trading at a new low for the move - below its declining blue 50-day moving average. Worse, the 50-day average is well below its declining red 200-day average. Not a pretty technical picture. The BIG question: Is the dollar on its way to a major down-leg, or is the dollar just temporarily slipping? If it's a big down-leg coming up, there's going to be trouble, and the trouble will start with the bonds and with interest rates."

Source: StockCharts.com
Other news is that the US Senate on Thursday approved a $2 billion extension of the government's car sales incentive program, "Cash for Clunkers", while the Federal Deposit Insurance Corp (FDIC) closed two more banks on Friday, bringing the tally of US bank failures in 2009 to 71 (96 since the beginning of the recession).
Also, according to the Financial Times, Bank of America is to pay $33 million to settle claims by US regulators that it made "materially false and misleading claims" to shareholders about bonuses that were paid by Merrill Lynch last year. Meanwhile, General Electric agreed to pay $50 million to settle the fraud charges brought by the Securities and Exchange Commission (SEC), accusing the company of bending its financial statements in 2002 and 2003 to boost its reported earnings, reported MarketWatch.
Next, a quick textual analysis of my week's reading. No surprises here with the usual suspects such as "bank", "market", "prices", "economy", "government" and "recession" featuring prominently.

The key moving-average levels for the major US indices, the BRIC countries and South Africa (where I am based) are given in the table below. All the indices are trading above their respective 50- and 200-day moving averages. The 50-day lines are also in all instances above the 200-day lines and therefore not threatening the bullish "golden crosses" established when the 50-day averages broke upwards through the 200-day averages.
Although these figures support the bullish case, one should bear in mind that some of the movements have been quite extreme, as borne out by the following:
• As far as mature markets are concerned, 76% are trading more than two standard deviations above their 50-day averages and 56% more than two standard deviations above their 200-day lines.
• Among emerging markets, 59% are trading more than two standard deviations above their 50-day averages and 68% more than two standard deviations above their 200-day lines.
These figures argue that some degree of reversion to mean is probably overdue. This could take the form of either a pullback or a consolidation (i.e. ranging) pattern. The June highs and July lows are also given in the table, as these levels define a support area for a number of the indices.
Click here or on the table below for a larger image.

Referring to my earlier comments about China, the graph below illustrates that for the fist time since mid-1999 emerging Asian stocks are trading at a premium of more than 35% to the 200-day moving average. This represents an overbought situation that is clearly not sustainable.

Source: US Global Investors - Weekly Investor Alert, August 7, 2009.
Considering the S&P 500's ten economic sectors, Bespoke provides very useful "sparklines" from which one can see at a glance where sectors are trading relative to their normal ranges - one standard deviation above and below the 50-day moving average - over the last year. As shown below, nine out of ten sectors are currently trading in overbought territory, with most having just recently hit their most overbought levels of the last year. The energy sector is the only one not yet overbought, but getting close. "As you can see in the sparklines, most sectors hit their most oversold levels over the last year nearly ten months ago. It's hard to believe that it has already been nearly a year since the crazy times of last September and October," said Bespoke.

Source: Bespoke, August 4, 2009.
Turning to fundamentals, with the bulk of the Q2 earnings reports in the US now in, 67.9% of the companies have beaten earnings estimates and 37.6% both earnings and revenue estimates. But, according to Bespoke, the most bullish aspect of this earnings season has been guidance. "After three quarters where companies guiding lower far outnumbered companies guiding higher, the trend has reversed to the positive side. As shown, 8.4% of companies reporting earnings have raised guidance in Q2, while 6.1% of companies have lowered guidance. Just two quarters ago, 15.7% of companies lowered guidance, while just 2.7% raised guidance."

Source: Bespoke, August 7, 2009.
The actual level of earnings nevertheless remains depressed, causing David Rosenberg (Gluskin Sheff & Associates) to comment as follows: "Based on past linkages between earnings trends and the pace of economic activity, believe it or not, the S&P 500 is now de facto discounting a 4.25% real GDP growth rate for the coming year. That is what we would call a V-shaped recovery. While it is possible, though in our opinion a low-odds event, it is doubtful that the economy is going to be better than that. So we have a market that is more than fully priced for a post-recession world - any further gains would suggest that we are moving further into the 'greed' trade."
Looking at the next few weeks, my assessment remains as stated a few days ago: "I am of the opinion that stock markets have run away from fundamental reality and that a pullback/consolidation looks likely. Taking a slightly longer-term view, I think we are in a (possibly lengthy) bottoming-out phase as far as slow-growth (OECD) countries are concerned, but already in new (potentially volatile) uptrends regarding high-growth emerging and commodities-related markets." Caution seems to be in order.
For more discussion on the direction of financial markets, see my recent posts "Global stock market moving averages hit full house", "Bob Farrell's 10 rules for investing", "Bullion regains its glitter", "Technical Talk: Balance bullish breadth with weak seasonal trends", "Picture du Jour: Keep a close eye on lending standards", and "Video-o-rama: Stabilization benefits risky assets".
Economy
Business sentiment is continuing to improve across the globe. The results of last week's Survey of Business Confidence of the World achieved its best level since early October, reported Moody's Economy.com. Businesses' broad assessments of current conditions and the outlook into 2010 have brightened meaningfully. However, despite the steady improvement in confidence, businesses are still very cautious and the Survey results remain consistent with a global economy that is still in recession.

Source: Moody's Economy.com
"Global manufacturing is clearly on the rebound, with survey reports on Monday showing activity contracting at a significantly slower pace in the US and continental Europe, and UK industry back on a growth path. The upbeat results added to evidence that the world's main economic regions stabilized in July, bringing closer the prospect of growth resuming," said the Financial Times.
Considering hard data, the surplus on Germany's foreign goods trade account rose to €11 billion on a seasonally adjusted basis in June, from a revised €10.2 billion in the previous month, according to the Federal Statistics Office. Exports rose at the fastest pace in almost three years. Although the surplus remains below the €18 billion recorded in June 2008, the outcome added to signs that Europe's largest economy was emerging from recession.
The European Central Bank (ECB) left its monetary policy unchanged at a historical low of 1% in August, while the Bank of England (BoE) Monetary Policy Committee held its key repo rate steady at an all-time low of 0.5%, but increased the size of its asset purchase program by an additional £50 billion to £175 billion.
A snapshot of the week's US economic reports is provided below. (Click on the dates to see Northern Trust's assessment of the various data releases.)
Friday, August 7, 2009
• July employment report - moderation of jobless is noteworthy
Thursday, August 6, 2009
• Jobless claims data are mildly positive
Wednesday, August 5, 2009
• ISM Non-manufacturing Index shows mild decline
• Factory orders higher
Tuesday, August 4, 2009
• June pending home sales - more evidence that trough in sales is behind us
• Real consumption expenditures in reverse in June
Monday, August 3, 2009
• ISM Manufacturing Index - overall tone is positive
• Construction spending rebounds in June
Regarding Friday's employment report being treated as a "green shoot" of major proportions, David Rosenberg said: "While it was by far the best jobs performance of the year, much of the better-than-expected tally in nonfarm payrolls reflected the bounce in auto production as well as the distortion from the federal census workers. Combined, these two influences effectively 'added' 100,000 to the headline number, so net-net, the consensus view of ?325,000 was not as far off the mark as the market believed at first glance. It may be dangerous to extrapolate today's report into a view that we are about to fully turn the corner on the job market front."
Subsequent to the jobs report, interest rate futures moved to reflect a 25 basis-point increase in the Fed funds rate at the January meeting of the Federal Open Market Committee (FOMC). Markets are also pricing in a first quarter point rate hike for the BoE and the ECB by January and February respectively.
Nouriel Roubini (RGE Monitor) pointed out a few bright spots amid the global recession, as reported by Forbes. He said: "All economies have been affected by the crisis, but a combination of policy responses and strong fundamentals has given some countries, especially some emerging-market economies, a relative edge. These same strengths could lead these countries to perform better as the global recovery begins.
"What do these countries have in common? One major theme is that they tended to have lower financial vulnerabilities due to more restrictive regulation and less developed financial markets, as well as larger and stronger domestic markets that sustained domestic demand. Moreover, they had the resources to engage in countercyclical fiscal and monetary policies - actions that were not possible in past crises."
The countries identified by Roubini are Brazil, Australia, China, India, The Philippines, Indonesia, Poland, Norway, France, Canada, Egypt, Qatar and Lebanon.
Week's economic reports
Click here for the week's economy in pictures, courtesy of Jake of EconomPic Data.
| Date | Time (ET) | Statistic | For | Actual | Briefing Forecast | Market Expects | Prior |
| Aug 3 | 10:00 AM | Construction Spending | Jun | 0.3% | -0.4% | -0.5% | -0.8% |
| Aug 3 | 10:00 AM | ISM Index | Jul | 48.9 | 48.0 | 46.5 | 44.8 |
| Aug 4 | 8:30 AM | Personal Income | Jun | -1.3% | -1.0% | -1.0% | 1.3% |
| Aug 4 | 8:30 AM | Personal Spending | Jun | 0.4% | 0.2% | 0.3% | 0.1% |
| Aug 4 | 10:00 AM | Pending Home Sales | Jun | 3.6% | 0.5% | 0.7% | 0.8% |
| Aug 5 | 8:15 AM | ADP Employment Change | Jul | -371K | -365K | -350K | -463K |
| Aug 5 | 10:00 AM | Factory Orders | Jun | 0.4% | -0.5% | -0.8% | 1.1% |
| Aug 5 | 10:00 AM | ISM Services | Jul | 46.4 | 48.5 | 48.0 | 47.0 |
| Aug 5 | 10:30 AM | Crude Inventories | 07/31 | +1.67M | NA | NA | +5.15M |
| Aug 6 | 8:30 AM | Initial Claims | 08/01 | 550K | 575K | 580K | 588K |
| Aug 7 | 8:30 AM | Nonfarm Payrolls | Jul | -247K | -370K | -325K | -443k |
| Aug 7 | 8:30 AM | Unemployment Rate | Jul | 9.4% | 9.7% | 9.6% | 9.5% |
| Aug 7 | 8:30 AM | Hourly Earnings | Jul | 0.2% | 0.1% | 0.1% | 0.0% |
| Aug 7 | 8:30 AM | Average Workweek | Jul | 33.1 | 33.0 | 33.0 | 33.0 |
| Aug 7 | 3:00 PM | Consumer Credit | Jun | -$10.3B | -$5.0B | -$5.0B | -$5.4B |
Click here for a summary of Wells Fargo Securities' weekly economic and financial commentary.
The Bank of Japan and the FOMC will make interest rate announcements on Tuesday (August 11) and Wednesday (August 12) respectively. US economic data reports for the week include the following:
Monday, August 10
None
Tuesday, August 11
Productivity, unit labor costs and wholesale inventories
Wednesday, August 12
Trade balance and Treasury budget
Thursday, August 13
Export and import prices, initial jobless claims, retail sales and business inventories
Friday, August 14
CPI, capacity utilization, industrial production and Michigan sentiment
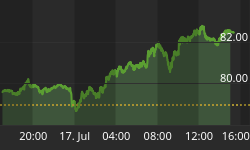
Markets
The performance chart obtained from the Wall Street Journal Online shows how different global financial markets performed during the past week.

Source: Wall Street Journal Online, August 7, 2009.
"Everyone is wrong in the markets at times. The difference between the great traders and the unsuccessful ones is in how long they stay wrong," said Brett Steenbarger, editor of the TraderFeed blog and author of the books The Psychology of Trading, Enhancing Trader Performance and The Daily Trading Coach. I have the privilege of meeting with Brett, arguably one of the leading trading coaches, during his visit to Cape Town later this week and look forward to exchanging ideas with him. In the meantime, let's hope the news items and quotes from market commentators included in the "Words from the Wise" review will keep the portfolios of Investment Postcards readers on target.
For short comments - maximum 140 characters - on topical economic and market issues, web links and graphs, you can also follow me on Twitter by clicking here.
That's the way it looks from Cape Town (where plenty of sunshine makes it hard to believe that August is supposed to be a winter month).

Source: Tom Toles
Forbes: Are there bright spots amid the global recession?
"This week, I take a look at which countries have best weathered the global recession and credit crunch. All economies have been affected by the crisis, but a combination of policy responses and strong fundamentals has given some countries, especially some emerging market economies, a relative edge. These same strengths could lead the countries I highlight below to perform better as the global recovery begins, even if their growth rates remain well below 2003-07 trends.
"What do these countries have in common? One major theme is that they tended to have lower financial vulnerabilities due to more restrictive regulation and less developed financial markets, as well as larger and stronger domestic markets that sustained domestic demand. Moreover, they had the resources to engage in countercyclical fiscal and monetary policies, actions that were not possible in past crises. In contrast, countries that borrowed heavily to finance domestic consumption in the days of easy money are now facing sharp economic contractions. Despite the relative strength of these countries, however, their ability to return to sustained growth will depend on structural reforms that support consumption."
The countries are: Brazil, Australia, China, India, The Philippines, Indonesia, Poland, Norway, France, Canada, Egypt, Qatar and Lebanon.
Click here for the full article.
Source: Nouriel Roubini, Forbes, August 6, 2009.
Financial Times: Industrial output on the rebound
"Global manufacturing is clearly on the rebound, with survey reports on Monday showing activity contracting at a significantly slower pace in the US and continental Europe, and UK industry back on a growth path.
"The upbeat results added to evidence that the world's main economic regions stabilised in July, bringing closer the prospect of growth resuming.
"'Everyone is benefiting from improvements in all their export markets - so it is magnifying the impact,' said Chris Williamson, chief economist at Markit, which produces purchasing managers' surveys for Europe and Asia.
"However, a return to solid growth was still not certain in many parts of the world, economists warned. Much of the recent improvement reflected companies rebuilding inventories, and was boosted by China's rebound, argued Marco Annunziata, chief economist at Unicredit. 'I'm worried that the world economy doesn't have the stamina to keep growing.'
"In the US, the July ISM manufacturing index rose 4.1 points to 48.94. This is the slowest pace of contraction since August 2008, before the collapse of Lehman Brothers, although still the 18th consecutive monthly decline. A figure below 50 marks the boundary between expanding and contracting activity.
"The eurozone manufacturing purchasing managers' index was revised higher to show its second strongest rise since the survey began in 1998. But at 46.3 in July, up from 42.6 in June, the survey still suggested that recovery in the 16-country region was lagging behind that in the US and UK.
"Germany largely powered the eurozone's improvement, reporting a record increase in its index and the first rise in new order volumes since June last year.
"But Markit described as 'remarkable' the turnround in the UK manufacturing index. The sector 'has clearly pulled out of the nosedive it was in earlier this year', said David Noble, chief executive of the Chartered Institute of Purchase and Supply, which co-produces the survey. The UK index rose from 47.4 in June to 50.8 in July, rising above the 50 level for the first time since March 2008.
"Japanese manufacturing is also expanding again, according to data last week, and Chinese manufacturing production rebounded further in July to rise at the fastest rate since May 2008, according to the country's CLSA purchasing managers' index. The index rose to 52.8 in July from 51.8 in June, marking the fourth consecutive month of expansion."
Source: Ralph Atkins and Simone Baribeau, Financial Times, August 3, 2009.
Gillian Tett (Financial Times): The liquidity pipes remain clogged
"A decade ago, I was working as a reporter in Tokyo when I was asked to investigate the impact of Japanese-style quantitative easing. Back then, the Bank of Japan was pouring gazillions of yen into the money markets and politicians were angrily exhorting the Japanese banks to lend.
"Indeed, at one point, the Tokyo government even created quotas, which stipulated that banks should make a certain level of loans to worthy small enterprises to combat a pernicious credit crunch.
"But, when I examined what the Japanese banks were actually doing, the results were almost comical. In public the banks claimed they were lending to small enterprises; in reality some were only meeting the targets by lending to subsidiaries of Toyota.
"Faced with a political order to lend, in other words, Japanese banks were ducking round the rules - and the liquidity was notably not ending up where politicians (or central bankers) had hoped.
"Sound familiar? I am increasingly tempted to think so. In the last six months, European and US central banks have poured dizzying sums into the money markets and politicians have put pressure on the banks to lend. Last week, for example, Alistair Darling, UK chancellor declared his readiness to 'get tough' with banks that were failing to lend. On Thursday, the Bank of England triggered surprise by announcing an expansion of its quantitative easing scheme.
"But as I look at these endeavours, what springs to my mind is a vision of a plumber trying to force water into a domestic waterflow system whose pipes are badly clogged, if not broken. To be sure, liquidity is entering the banking pipes. Some is also trickling out at the end: banks still seem willing to lend to big, reputable companies (the Western equivalent of Toyota, as it were.)
"However, numerous small or risky corporate ventures in the west currently complain that they cannot get loans. Consumers are facing rising borrowing charges too. Thus, in the West, as in Japan a decade ago, the liquidity is still not necessarily flowing to those who need it most. Those pipes remain clogged, even as water is forced in.
"That, in turn, raises a fascinating question for investors and policy makers: where will all that 'backflow' of unusued liquidity, as it were, go? Right now, some seems to be sitting in a quasi stagnant pool, deposited into reserve accounts with central banks.
"Much also seems to be leaking into the government bond markets, or moving directly there (as in the case of the British central bank's direct purchase of gilts). That is helping to keep long-term yields low, echoing the pattern seen previously in Japan.
"But the longer that the banking pipes remain partly or fully clogged and the governments keep pouring water into the system, the more that investors and policy makers need to watch what this liquidity 'backflow' might do; and not just in the gilts market, but other, less obvious corners of the global asset markets too."
Source: Gillian Tett, Financial Times, August 6, 2009.
Floyd Norris (The New York Times): Donald is back
"If Donald Trump can borrow money to finance casinos, then the credit crunch must really be over.
"It is with a great sense of joy that I read today that Donald Trump is almost back in the casino business.
"The article reports that Mr. Trump and his daughter, Ivanka, along with 'an affiliate of Beal Bank Nevada', have bid $100 million to take Trump Entertainment Resorts out of bankruptcy. Shareholders will get nothing, I am sure, and those who previously lent to Mr. Trump's casino enterprise will suffer as well.
"My favorite paragraph in the article is:
"'My previous investment in the company was destroyed by excessive and restrictive debt,' Mr. Trump said. 'This reorganization changes all that. I am pleased that the reorganization affords me an opportunity to make a new investment and help revive a company that has borne my name, but not performed to my standards.'
"I like the phrase 'excessive and restrictive debt', spoken as if Mr. Trump had nothing to do with the company being burdened by debt. As for restrictive, I'm sure he did chafe at any restrictions at all.
"So why do I feel joy at the news?
"If a casino company run by Mr. Trump can get credit, then the credit crunch must surely be over.
"Have you defaulted on a mortgage loan? Or maybe two? Fear not. That leaves you with a better record than Trump casino companies."
Source: Floyd Norris, The New York Times, August 4, 2009.
Financial Times: "Cash for clunkers" gets $2 billion boost
"The US 'cash for clunkers' programme, which pushed July car sales higher after a record-breaking slump, tripled in size on Thursday as the Senate extended it by $2 billion.
"Hostile amendments were easily defeated in a final vote of 60-37, following sustained White House and industry pressure.
"President Barack Obama commended the Senate for 'acting in a bipartisan way' with the vote.
'Now, more American consumers will have the chance to purchase newer, more fuel-efficient cars and the American economy will continue to get a much-needed boost,' he said.
"'Cash for Clunkers' has been a proven success: the initial transactions are generating a more than 50% increase in fuel economy; they are generating $700 to $1,000 in annual savings for consumers in reduced gas costs alone.
"'This programme gives a much needed jolt to our economy and our manufacturers at a critical time,' said Harry Reid, Senate Majority leader, after the vote.
"The initial $1 billion allocated to the programme has been nearly exhausted just days after its start. The House of Representatives voted last week to boost it with energy efficiency funds from the $787 billion economic stimulus package - the measure under the Senate's consideration on Thursday."
"Under the scheme, customers trading in a vehicle for one with more miles per gallon can qualify for a government subsidy of up to $4,500.
"'This is a wildly popular programme and enormously successful and it helps many segments of our economy,' Ray LaHood, secretary of transportation, said this week, adding that more than $700 million had already been spent subsidising almost 200,000 new vehicles.
"The extra $2 billion will allow 500,000 more vehicles to be traded in for more fuel efficient replacements."
Source: Daniel Dombey, Financial Times, August 6, 2009.
Clusterstock: Thanks Cash-for-Clunkers!
"It wasn't pretty, and it wasn't by much, but Ford managed to report year-over-year sales growth in July. It was the first such gain since 2006, and they were helped in large part by Cash-For-Clunkers, which powered blistering car sales in the final week of the month. Of course, all those sales will come out of future sales ... but that's another problem."

Source: Joe Weisenthal and Kamelia Angelova, Clusterstock - Business Insider, August 3, 2009.
Financial Times: Wall Street profits from trades with Fed
"Wall Street banks are reaping outsized profits by trading with the Federal Reserve, raising questions about whether the central bank is driving hard enough bargains in its dealings with private sector counterparties, officials and industry executives say.
"The Fed has emerged as one of Wall Street's biggest customers during the financial crisis, buying massive amounts of securities to help stabilise the markets. In some cases, such as the market for mortgage-backed securities, the Fed buys more bonds than any other party.
"However, the Fed is not a typical market player. In the interests of transparency, it often announces its intention to buy particular securities in advance. A former Fed official said this strategy enables banks to sell these securities to the Fed at an inflated price.
"The resulting profits represent a relatively hidden form of support for banks, and Wall Street has geared up to take advantage. Barclays, for example, e-mails clients with news on the Fed's balance sheet, detailing the share of the market in particular securities held by the Fed.
"'You can make big money trading with the government,' said an executive at one leading investment management firm. 'The government is a huge buyer and seller and Wall Street has all the pricing power.'
"A former official of the US Treasury and the Fed said the situation had reached the point that 'everyone games them. Their transparency hurts them. Everyone picks their pocket.'
"The central bank's approach to securities purchases was defended by William Dudley, president of the New York Fed, which is responsible for market operations. 'We believe that opting for transparency is a greater good,' he said. 'If we didn't have transparency, we'd be criticised on other grounds.'
"Barney Frank, chairman of the House financial services committee, said the potential profiteering may be part of the price for stabilising the financial system."
Source: Henny Sender, Financial Times, August 2, 2009.
Clusterstock: Finance jobs vanish into thin air
"The severe bloodletting in the construction industry is slowly waning. The pace of layoffs is coming well off its peak, according to ADP, probably since companies don't have much more room to cut. But financial services? Despite the improved picture, the layoffs continue at a steady clip, with little month-over-month improvement."

Source: Joe Weisenthal and Kamelia Angelova, Clusterstock - Businessinsider, August 5, 2009.
CNN Money: Recession is over, says economist
"When economist Dennis Gartman told subscribers of his newsletter in the fall of 2007 that the US was entering a recession, the Dow was at 13,500, and the official government call wouldn't come for another full year.
"Now he's ahead of officials and forecasters again. According to Gartman, the US recession that started in December 2007 is done.
"'We saw it happen two weeks ago - it's over,' he said in a recent interview.
"Other well-known economists and market watchers have recently been hinting at the same thing. NYU economics professor Nouriel Roubini, also known as 'Dr. Doom' for his prescient predictions of the worldwide downturn, says the US recession will end later this year. Treasury Secretary Timothy Geithner said last weekend that the recession is easing. And President Obama told Univision last week, 'We maybe are beginning to see the end of the recession.'
"But Gartman says the Great Recession ended in July.
"'Too many people get too arcane and have too many arguments about why an economy goes into or comes out of a recession,' he says. 'Having done this for 35 years, I've fallen into using just a couple of indicators that characteristically have done a very good job."
"'The first is a spike downward in the number of weekly jobless claims, which unlike the unemployment rate, focuses on newly laid off workers. Gartman doesn't seek a specific percentage decline (such as when a 20% decline denotes a bear market), but instead he waits for a sharp downward trend. 'It's like the definition of pornography: I'll know it when I see it,' he says.
"Gartman then looks at a ratio from the Conference Board: the percentage of coincident economic indicators to lagging indicators. The ratio measures changes in the economy by dividing coincident (or real time) economic indicators like industrial production and personal income by lagging indicators, like the unemployment rate. So, if during a recession coincident indicators increase at a faster clip than lagging indicators, the economy is expanding and the ratio rises.
"As Gartman notes, that ratio has been rising three months in a row. It increased to 90.5 in June from 89.4 in March. According to Gartman and Conference Board data, the fall in jobless claims and a rise in the ratio correlate with the end of recessions since 1959.
"He expects economic indicators to slowly turn positive by October, but he's careful to remind investors that 'the news is horrible at the bottom of a recession. It's going to be terrible for another couple months'. Because it's a lagging indicator, Gartman expects unemployment to rise into 2010."
Source: Scott Cendrowski, CNN Money, August 6, 2009.
MoneyNews: Greenspan - recession over, growth ahead
"Former Federal Reserve Chairman Alan Greenspan thinks the economy has already turned around.
"Greenspan told ABC News on Sunday he's 'pretty sure we've already seen the bottom'.
"Now, companies must restock quickly to get ahead of demand, which he sees spiking higher in the third quarter.
"'It strikes me that we may very well have 2.5% in the current quarter,' he said.
"The economic contraction slowed in the second quarter, to 1% annualized, down sharply from a 6.4% drop in the first three months of the year. Forecasters had expected negative 1.5% growth in the second quarter."
Source: Greg Brown, MoneyNews, August 3, 2009.
Rebecca Wilder (News N Economics): The oddities of this recession
"It is not a rule that the personal saving rate rises during a recession, just in this one. Take a look at the cumulative trajectory of the personal saving rate for this Great Recession compared to its predecessors, as represented by the 'average recession' since 1960.
"The chart illustrates the cumulative growth of the saving rate throughout the recession period and during the twenty-four months (of recovery) following the recession for the current cycle and the average over the latest 7 cycles. Note: convenience only, I call the end of the current cycle at point 0 or June 2009. I do not believe that the recession is actually over in June.
"Recently, the average saving rate, which is estimated monthly by the Bureau of Economic Analysis, surged since the onset of the longest recession in the post-War era. Consequently, the sharp ascent of the marginal saving rate is wreaking havoc on personal consumption spending, and thus, GDP.
"Interestingly, current saving trends mark opposing behavior relative to the 'average' recession occurrence, which is the indexed trajectory of the average saving rate spanning the 7 recessions since 1959. The saving rate drops during the average recession, and stabilizes thereafter. So far, the saving rate has a -50% correlation with the saving trend during 'average recession', and is moving against the broader historic trend. If saving continues its ascent, one can discount quite significantly the possibility of an 'average recovery' to a recession this deep (i.e. V)."

Source: Rebecca Wilder, News N Economics, August 5, 2009.
Bill King (The King Report): Taxes - statistic that yields the truest economic picture

Source: Bill King, The King Report, August 3, 2009 (hat tip: Matt Trivisonno).
MoneyNews: Stiglitz - Obama will have to raise taxes
"President Barack Obama will have to raise taxes if he wants to push through his healthcare reforms, says Nobel Laureate economist Joseph Stiglitz.
"And that's not necessarily a bad thing - if tax increases take place down the road when economic recovery is more prevalent, he says.
"'If we get a more balanced view of our balance sheet, we'll realize that if we spend our money well then these great extra expenditures are going to actually make our economy more productive in the future,' Stiglitz told Yahoo! Finance.
"Spending on technology, education and infrastructure 'will generate revenues that will allow us in the future to pay back any borrowing or lower taxes'.
"President Obama said during his campaign that he would not raise taxes to finance healthcare reform. Yet his leading economists, Treasury Secretary Tim Geithner and National Economic Council Director Larry Summers, recently hinted that tax hikes may be necessary.
"Stiglitz says we're already paying for not reforming healthcare by helping the uninsured with their medical costs - for instance, when hospitals write-off indigent care but raise prices on paying patients with health coverage.
"'Right now we're often paying for it in hidden charges so it's like a tax but it's a hidden tax,' Stiglitz said."
Source: Forrest Jones, MoneyNews, August 4, 2009.
Asha Bangalore (Northern Trust): July employment report - moderation of jobless is noteworthy
"The civilian unemployment rate edged down to 9.4% from 9.5% in July. The decline in the unemployment rate has to be viewed with caution because the dip in the jobless rate was due to a sharp drop of the labor force in July (-422,000), while employment declined 155,000. The payroll adjusted estimate of employment, a volatile series, rose 70,000 in July. There is a good chance that the August report will show an increase in the labor force after two monthly declines and a higher unemployment rate.
"Nonfarm payrolls fell 247,000 in July after an upwardly revised decline of 443,000 in June. The July drop in employment is the smallest decline since August 2008. The loss of jobs was smaller in most categories compared with the trend seen in recent months. The average loss of jobs in the May-July period is 331,000, nearly half of the pace recorded in the February-April span (-617,000). On a year-to-year basis, seasonally unadjusted payroll employment fell 4.18% during July vs. a 4.19% drop in June, probably the cycle high reading.

"Conclusion - The Fed policy statement of August 12 is most likely to reflect the mildly bullish nature of the July employment report and second quarter GDP report. The Fed is on hold for all of 2009, unless there is a robust turnaround in economic conditions. The small drop in the unemployment rate during July is not the beginning of consecutive monthly declines of the jobless rate, it occurred because a large number left the workforce in July. A significantly higher unemployment rate is nearly certain by the middle of 2010. Having said that, the improvements in the employment numbers are noteworthy as the economy is now recording smaller job losses than in the prior few months."
Source: Asha Bangalore, Northern Trust - Daily Global Commentary, August 7, 2009.


