


The good news is:
• Many of the major indices hit multi month highs last week.
Short Term
NASDAQ new highs tumbled to 15 on Friday, the lowest number since July 13, the beginning of the monster rally in late July.
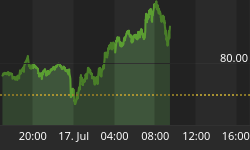
The chart below is an update from last week covering the past 6 months showing the NASDAQ composite (OTC) in blue and a 10% trend (19 day EMA) of NASDAQ new highs (OTC NH) in green. Dashed vertical lines have been drawn on the 1st trading day of each month.
The current value of the indicator is 51. The rally will not resume until NASDAQ new highs consistently exceed 51.

Intermediate term
New highs continued to decline last week week, but, there were no new lows (only 1 on Friday). The market will not be in any real trouble until new lows begin to expand.
The chart below covers the past 6 months showing the OTC in blue and a 40% trend (4 day EMA) of NASDAQ (new highs / (new highs + new lows)) (OTC HL Ratio) in red. Dashed horizontal lines have been draws at 10% increments for the indicator, the line is solid at the neutral 50% level.
Risk will be limited as long as the indicator remains above the 50% level.

Seasonality
Next week includes the 5 trading days prior to the 3rd Friday of August during the 1st year of the Presidential Cycle.
The tables show the daily return on a percentage basis for the 5 trading days prior to the 3rd Friday of August during the 1st year of the Presidential Cycle. OTC data covers the period from 1963 - 2008 and S&P 500 (SPX) data from 1953 - 2008. Prior to 1953 the market traded 6 days a week so that data has been ignored. There are summaries for both the 1st year of the Presidential Cycle and all years combined.
Over all years the average returns have been modestly positive, however, during the 1st year of the Presidential Cycle average returns have been extremely negative. Seasonally, next week is one of the worst weeks of the year.
Report for the week before the 3rd Friday of August.
The number following the year is the position in the presidential cycle.
Daily returns from Monday through 3rd Friday.
| OTC Presidential Year 1 | ||||||
| Year | Mon | Tue | Wed | Thur | Fri | Totals |
| 1965-1 | 0.70% | -0.22% | 0.26% | 0.24% | -0.26% | 0.72% |
| 1969-1 | -0.29% | -0.79% | -0.94% | -0.10% | 0.42% | -1.71% |
| 1973-1 | -0.92% | -0.73% | -0.23% | -0.04% | 0.39% | -1.53% |
| 1977-1 | 0.13% | -0.24% | 0.07% | 0.14% | -0.01% | 0.09% |
| 1981-1 | -1.16% | -1.26% | 0.10% | 0.36% | -0.58% | -2.54% |
| 1985-1 | -0.28% | -0.43% | 0.21% | -0.01% | -0.39% | -0.90% |
| Avg | -0.51% | -0.69% | -0.16% | 0.07% | -0.03% | -1.32% |
| 1989-1 | -1.40% | 1.08% | -0.03% | 0.01% | 0.25% | -0.09% |
| 1993-1 | 1.20% | 0.57% | 0.52% | -0.59% | 0.07% | 1.76% |
| 1997-1 | -0.73% | -0.67% | 0.46% | 0.21% | -1.56% | -2.29% |
| 2001-1 | 1.32% | -0.89% | -2.32% | 0.60% | -3.28% | -4.58% |
| 2005-1 | 0.47% | -1.38% | 0.38% | -0.42% | -0.02% | -0.98% |
| Avg | 0.17% | -0.26% | -0.20% | -0.04% | -0.91% | -1.24% |
| OTC summary for Presidential Year 1 1965 - 2005 | ||||||
| Avg | -0.09% | -0.45% | -0.14% | 0.03% | -0.45% | -1.10% |
| Win% | 45% | 18% | 64% | 55% | 36% | 27% |
| OTC summary for all years 1963 - 2008 | ||||||
| Avg | 0.24% | -0.04% | 0.24% | 0.02% | -0.08% | 0.36% |
| Win% | 65% | 49% | 61% | 53% | 54% | 54% |
| SPX Presidential Year 1 | ||||||
| Year | Mon | Tue | Wed | Thur | Fri | Totals |
| 1953-1 | -0.24% | -0.41% | -0.61% | -0.08% | 0.25% | -1.10% |
| 1957-1 | -1.26% | -0.06% | -1.23% | 0.04% | 0.17% | -2.33% |
| 1961-1 | -0.50% | -0.25% | 0.27% | 0.56% | 0.26% | 0.34% |
| 1965-1 | 0.12% | 0.20% | -0.06% | -0.23% | -0.12% | -0.09% |
| 1969-1 | -0.62% | -0.78% | 0.08% | 0.69% | 0.71% | 0.07% |
| 1973-1 | -1.01% | -0.96% | 0.29% | -0.70% | 0.02% | -2.36% |
| 1977-1 | 0.31% | -0.46% | 0.01% | -0.06% | -0.17% | -0.38% |
| 1981-1 | -0.96% | -0.85% | 0.29% | 0.15% | -1.12% | -2.48% |
| 1985-1 | -0.37% | -0.18% | 0.06% | -0.08% | -0.62% | -1.18% |
| Avg | -0.53% | -0.65% | 0.15% | 0.00% | -0.24% | -1.27% |
| 1989-1 | -0.49% | 0.48% | 0.28% | -0.35% | 0.46% | 0.38% |
| 1993-1 | 0.50% | 0.17% | 0.64% | 0.09% | -0.06% | 1.33% |
| 1997-1 | 0.37% | -1.12% | -0.49% | 0.30% | -2.59% | -3.53% |
| 2001-1 | 0.09% | -0.38% | -0.73% | 0.31% | -1.67% | -2.38% |
| 2005-1 | 0.28% | -1.18% | 0.07% | -0.10% | 0.06% | -0.86% |
| Avg | 0.15% | -0.41% | -0.05% | 0.05% | -0.76% | -1.01% |
| SPX summary for Presidential Year 1 1953 - 2005 | ||||||
| Avg | -0.27% | -0.41% | -0.08% | 0.04% | -0.32% | -1.04% |
| Win% | 43% | 21% | 64% | 50% | 50% | 29% |
| SPX summary for all years 1953 - 2008 | ||||||
| Avg | 0.19% | -0.02% | -0.02% | 0.03% | 0.07% | 0.24% |
| Win% | 66% | 50% | 55% | 50% | 63% | 54% |
Money supply (M2)
The money supply chart was provided by Gordon Harms. Money supply growth fell back last week.


Conclusion
Intermediate term, there are no significant negatives for the market, however, short term the market has nothing going for it. New highs are falling, seasonally next week is terrible and money supply growth is falling.
I expect the major indices to be lower on Friday August 21 than they were on Friday August 14.
Gordon Harms produces a Power Point for our local timing group meetings. You can get a copy of that at: http://www.stockmarket-ta.com/.
This report is free to anyone who wants it, so please tell your friends. They can sign up at: http://alphaim.net/signup.html. If it is not for you, reply with REMOVE in the subject line.
Thank you,


