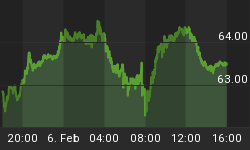
The critical juncture we suggested for silver last week has not changed. All the factors we have looked at point to silver dropping in the medium term though the shorter term (days to weeks) has scope for volatility. The RMA parameter mentioned before has sounded an alarm but for now a low decibel one. Other factors though are more shrill (refer to my blog for more details).
What I would like to point out (again) is that any correction is not the end of the matter for the gold and silver bull. The gold "M2 supply" chart we displayed some weeks back paints the picture of a bull market that is not over yet. This is an important chart that I think needs to be properly digested (gold cycles in black, silver price in red).

The strong implication of this chart is that gold and silver have a few years left to run higher. In this remaining time frame I expect gold to challenge the 1980s highs on an inflation adjusted basis. Gold made new nominal highs at $1032 in March 2008 but that is well short of the inflation adjusted 1980 high of about $2500. Silver is unlikely to challenge its inflation adjusted high of $135 unless a mega-buyer like the Hunt brothers steps in again but the nominal high of $52 is certainly an objective.
The timeframe for this blow off is 2012 at the earliest which brings me to another issue. In terms of Elliott Wave Analysis, I used to think that gold and silver would both trace out a five part impulse wave from the beginning (1999 or 2001 for gold) and we would witness a classic fifth wave climax in the distant future.
I don't think that will happen now - the projected 2012 timeframe does not allow enough time for it. If wave 1 was 1999/2001 to 2008 and this is a current wave 2 correction then two of the five waves have already occupied at least 8 years of a possible 13+ year bull market. That does not leave much time for waves 3, 4 and 5. So my opinion is that the entire bull market will be a three wave affair of which the second wave is nearing completion. Another confirmation for that is that the 1964-1980 bull was a distinct three wave pattern. The final third wave will outdo the first bullish wave and if we take the first gold bull wave to be from $255 to $1032 and multiply it by a likely Fibonacci 1.618 extension then the final blow off third wave for gold could reach out to about $2000 (i.e. $700 + ($1032-$255)*1.618) but it could of course go higher.
Applying the same projections to silver brings us to a minimum projection of $35 but it could spike briefly higher (i.e. $8.50 + ($21.34 - $4.50)*1.618)). By some coincidence, we also note that $35 is also simply $21 multiplied by 1.618. I would also point out that a projected line from the 2004, 2006 and 2008 silver highs extends out to the low $30s as a possible confirmation. Silver and gold stocks will naturally leverage higher by a factor of 2:1 or more.
That all sounds exciting for the precious metals investor but for the meantime investors need to be prepared for a medium term wash out in preparation for the next and final great buying opportunity.
Further analysis of silver can be had by going to our silver blog at http://silveranalyst.blogspot.com where readers can obtain a free issue of The Silver Analyst and learn about subscription details. Comments and questions are also invited via email to silveranalysis@yahoo.co.uk.


