


Market Overview:
We can remember the beginning of October as the time when the major indexes across the board lost their 20 day exponential moving averages. The market had traded above them for many months. So long in fact that they were able to cross over the 50 day exponential averages which is quite bullish. In bullish trends the lowest moving averages are trading above the next highest ones we follow such as 20's over the 50's and 50's over the 200's. Things had been going along beautifully for quite some time but the past few months saw much more of a grind as we began to encounter negative divergences on each new move higher on those important daily charts. Not only that, but we also saw massively overbought conditions take place not only on those daily charts but on the weekly charts as well. A lethal combination that had gone ignored for quite some time, thus the reason for not shorting even though it felt like we should. Last week we started to see some signs that there may be trouble when we got up to 1080 on the SP, the gap top from the October 2008 gap down to 1060. We had traded in that gap for some days before finally reaching the top and then reversing back down hard. On Monday of this week we made another attempt to get back through the bottom of that gap at 1060 but that failed and down we went ever since. On Thursday we finally lost the 20 day exponential moving averages on some bad economic news, although in reality those reports were just an excuse for what was going to happen anyway. On Friday we had an absolutely horrific jobs report that took the market below those line in the sand 50 day exponential moving averages pre market. I reported this week that it was extremely unlikely we'd take out those 50's on the first test and somehow that became a reality as we gapped down just above those levels and climbed back for the rest of the day. The news was bad enough to justify a loss of the 50's but the market refused to give way. At that moment of testing the short term charts had gotten extremely oversold with rsi levels averaging 25 on the major indexes. Anything below 30 is extremely oversold thus the combination of oversold and critical support gave the bulls some life. They fought and held but it wasn't exactly a rousing reversal up either. With the 20's now lost, that area should act as some resistance on moves back up and with in mind, the bulls are less likely to get aggressive should we approach those levels in the days to come. Although we held those 50 day exponential moving averages today, there was some technical damage to this market this week. It doesn't mean things are over for the bulls but it does mean any further upside from here will be more difficult than it had been in the past months.
There are many who are already declaring the bull market off the March lows dead. That may very well be true but don't fool yourselves in to thinking it's a done deal either. It is normal and expected for markets to test down to those 50 day exponential moving averages from time to time. That allows for the oscillators to unwind and for any negative divergences that formed to be wiped out. The higher you go in a bull, meaning the higher those Macd's go, the odds increase that at some point they won't be able to keep up with price thus creating the negative divergences. You can't have those hold on forever thus the selling that takes place. It does not mean that all is lost despite the increasing bad news on the economic front. The battle will now rage between the 20 day and 50 day exponential moving averages for a while and how that is resolved will tell us if the bull is truly dead or if its just taking some well deserved time off to continue and unwind things to the oversold level on the daily's. If we get oversold on the daily charts and we hold on to the 50's then you have to think things aren't nearly as bad as they looked this week, especially the past few days. On the other hand, if the move up is weak and labored we have to consider the fact that the bull is about to end. It is totally unclear which way it'll break because if you study the daily charts, they are almost oversold now. We are truly at a crossroads here. It'll be no fun for folks if we lose those 50's because that opens the door for another leg down in the bear market and this would have been nothing more than a rally in that bear market. It won't take long to get our answer folks. The battle between the 20's and 50's is not a wide and lose one. It's tight. The Sp 20 is at 1043 with the Sp 50 at 1017. There is also gap at 1017. This is an additional buffer for the bulls but a death knell for this market should it get taken out with force. Patience as we learn the truth.
When studying the divergences, stochastic's and other oscillators on key sectors of this market we see them pointing lower but at least they're getting closer to oversold. The RSI's are somewhat troubling as they are the one oscillator of significance that is not as oversold as the bulls would like. Still in the mid 40's and as we know, not until we hit 30 are we really oversold. Stochastic's alone are not enough to declare a market oversold. You need the RSI to confirm. In other words, there is the necessary room for the bears to seize on things and take this market below those line in the sand 50 day exponential moving averages. Now we often see things pointing down as we do now and suddenly find them turn back up at these levels of unwinding thus there's hope. It's not great as they look now and the red flag should be up in your mind but it's not as if there's no hope for the bulls here. In a true bull market, we often see the RSI's turn back up right where they are now, in the 40's. Not the best looking charts and you should be prepared for the possibilities but don't give up hope, if you're a bull, that these oscillators can turn from right where they are now. In the end, it's all about the Sp holding 1017 while the Nasdaq needs to hold 2025 our key 50 MA Support levels. Please take note that all our the major Indices seen below in charts 1-5 are currently in the process of testing our important 50 MA's. If they hold our bull trend remains in tact. Should they give way in convincing fashion all bets are off. We are at the moment of truth.
Sentiment:
Sentiment is not on the side of the bulls here although they're not at levels that necessarily say it's all over. The spread is getting a bit wide amongst the traders but when we study the advisors sentiment, it's quite the opposite with more bears than bulls. Of course the traders matter more than the advisors and the spread isn't too far from 30%. We have not seen extreme readings on either side of the put call world. No major readings above 1.00 and not too many below 0.70. In other words, not too much in terms of complacency nor fear. Per the Investors Intelligence Survey Bulls are up to 50% and Bears down to 23% a widening spread which has kept us somewhat cautious over the past week or two. During Fridays session both the VIX/VXN flamed out late session showing some hesitation at resistance.
Sector Watch:
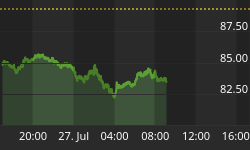
Most Sectors continue to correct back with the market towards important 50 EMA and Uptrend Support Lines off our March Lows. We've included a chart of the Transports seen in our 6th chart below that more or less mirrors the Nasdaq, SP 500, Dow, QQQQ and Russell 2000 Charts seen below in that most key groups are now testing back to our important Uptrendlines off the March Lows and 50 EMA's. Most Commodities are testing the bottom of their respective Rising Wedge Patterns. The Oil Services Sector pulled back about $10 over the past week and is now also testing some major Support. The BKX/Financial Sector Chart put in a Doji today or hesitation candle right off our 50 EMA Support. Next week will be an interesting one to say the least with the battlelines drawn at our critical 50 EMA Supports.
The Week Ahead:
The week ahead is one the market may have to remember adversely for a very long time. The bulls are fighting for their bull market lives here. It would be extremely bearish if the market loses those 50 day exponential moving averages across the board. The key of course is doing this on a closing basis. There are the usual number of economic reports, all of which lately have come in poorly. We need to see a turn in that for the market to have much of a chance. Do keep in mind that a breach of the 50's on an intra day basis is meaningless. It's how we close. Also, you don't really take a breakdown seriously if we lose the 50's by a point or two. You need to see a breakdown and run down even lower to get true confirmation. I will be watching and updating for all of you of course. Nothing aggressive short or long until we get resolution folks. In fact mostly to all cash would be entirely acceptable which we have mostly been for the past week or two.


