


Investors Are Wise To Remain Flexible: The bearish spin on unemployment is obvious. The bullish spin is weak employment means low interest rates which is good for asset prices. Another possible spin by the bulls is "sell the rumor (weak employment) and buy the news (Friday's report)". Ultimately, it matters how the market (in the collective minds of participants) chooses to spin it, not how we at CCM choose to spin it. Nor does it matter how any one individual, one columnist, one market guru, one money manager, one firm, or one talking head chooses to spin it. The market sets asset prices, not individuals or gurus. You'll hear a lot of "the highest unemployment rate in 26 years" in the next 72 hours. Keep in mind, 26 years ago was 1983, another period of negative investor sentiment. Sentiment is a contrary indicator - markets do well when people are pessimistic. Stock market performance from 1983 to 2000 is shown below to stress the importance of keeping an open mind as you read all the gloom and doom articles in the coming days. An open mind means open to bullish and bearish outcomes, despite negative sentiment. An open mind, means remaining flexible enough to react to bullish or bearish conditions as new information comes to light, both via the news cycle and the market's reaction to the news.

On Friday, before the open, the futures on the S&P are at 1,056. Therefore, a trade in the next few days between 1,045 and 1,072 may offer little in the way of new insight. Moves outside these levels, especially on strong volume, would get our attention. We remain in a bull market, but the bears still have a hold on the correction, which means we need to be open to both bullish and bearish outcomes in the short-to-intermediate term. A cycle low comes in near the end of November - just something to keep in mind should the S&P take out 1,045, and more importantly 1,038.

The charts below show slight bullish slant in Thursday's strong stock market breadth. We still need to see some decisive volume on the major exchanges - somewhat lackluster ahead of Friday morning's employment report.

Chart below is as of Thurday's market close.

Heading into Thurday's trading session there were reasons to remain somewhat patient with the employment data due on Friday. Numerous reputable sources had forecast a number near 225,000 for Friday's report, which is above the consensus of a loss of 175,000 jobs. A big miss on Friday could derail a low volume rally. However, anything close to consensus or under 215-ish could allow for a continuation of the rally attempt based on expectations ("whisper number") for a weak report. The orange box in the chart below shows the intersection of four forms of resistance which may come into play sometime in the next week to ten days if the bulls can push stocks higher. The take away from the chart below is simple - the S&P 500 faces resistance near 1,072.
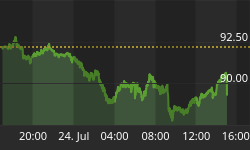
As of Thursday at 1 PM ET.

Most of our short-term allocation decisions will be based on how things play out relative to the chart above. From where we sit, it makes sense to see the outcome around or below 1,072 before making any significant moves one way or another. Other than volume, most information currently at hand is bullish for the short-to-intermediate term. We will see how the market reacts to Friday's employment report. We still remain in a correction within a bull market - we want to see some evidence backing a probable end to the correction - we have a good start, but we need to see a few more things (as of Friday morning).
After Wednesday's close, the S&P 500 was showing a few signs of life.....not enough to remove our defensive bias with cash, but enough to become more open to bullish outcomes. The charts below were not meant to forecast anything (they were first published before the open on Thursday). They illustrated some things that had already happened and some things that we wanted to see happen (or still want to see happen). We also have to remind ourselves that we remain firmly in a bull market. Despite the recent correction, no significant damage has been done to the bull market as of this writing. We are trying to bounce from oversold conditions within the context of an ongoing bull market - that is usually a positive combination. Flexibility and an open mind remain very important.

Chart below is as of Wednesday's close.

These charts above do not imply that 2003 and 2009 are going to follow identical paths. The exercise simply illustrates some things to look for at the end of a sharp correction - nothing more than that. Short-covering could add fuel to any successful rally attempt. If (a) and (b) from above occur, it improves the odds of further gains in the coming days, meaning we would be more inclined to buy than sell. No need to jump the gun - the market will either take care of (a) and (b) or it will fail to do so, which would imply more downside or sideways consolidation. A break of 1,072 supports the potential for more upside. A break of 1,038 may foreshadow a continuation of the current correction (possibly into the late November cycle low).


