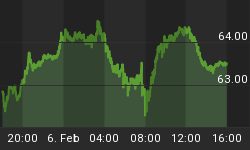
We think it is important enough to post everyday on our paid website ... what is it?
It is a chart of how much selling Institutional Investors do everyday, and what the short term trend of that selling is.
If you have read our updates in the past, you know that we have consistently said that an investor should NEVER go against what Institutional Investors are doing. To do so can sometimes be investor suicide.
As a courtesy to our Free Members, we are posting our Institutional Selling chart today. The chart below goes back to this past July and there been 8 up or down changes in the Institutional Selling Trend since then.
Take a look at the chart below and see how the NYA (New York Stock Exchange) shifts its direction in accordance to what Institutional Investors are doing relative to Selling. Institutional Selling action is a market direction indicator that every investor should have on their side.


