


Market Wrap
Week Ending 11/13/09
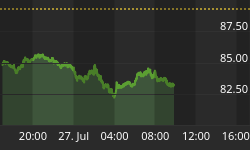
Dollar
The dollar was down 0.69% for the week, closing at 75.23. Below is the daily UUP chart, which shows the dollar attempting to carve out a short term bottom. It remains to be seen if it can muster the needed resolve.
The dollar has been falling relentlessly since March. Its first resistance area is at 23. If the dollar can break and hold above 23 then the other Fib retracement levels may come into play. Short term rates will be the key to the dollar's direction.
The direction of the U.S. Dollar has a big affect on all the markets, most of which trend in the opposite direction. While stocks, commodities, and precious metals have risen since March, the dollar has steadily declined.

As the chart shows, short term rates have been falling almost in lockstep with the dollar. If short term rates rise, the dollar will not be far behind. So far rates have not risen and the music plays on.

Gold
Gold continues to rise relentlessly, just as the dollar continues to fall relentlessly. Our currency is a national disgrace. Gold is the strongest currency in the world- since time immemorial.
For the week gold gained $24.00 (+2.19%) to close at a new all-time high of $1119.20 (continuous contract). The daily chart below shows gold's recent breakout above $1000, a move higher followed by consolidation, and the recent move higher: a sweet pattern.
The falling dollar has given gold a definite lift, but as the charts show (in the full market wrap with charts of gold denominated in foreign currencies), gold has been rising in all currencies.
Gold is the strongest currency bar none. Gold is also the strongest asset in the world- the only one making all-time highs; which is why we offered a money back guarantee on subscriptions if gold didn't make new highs this year. We were confident- on gold.

The weekly chart shows gold rising from the lower left hand corner of the chart to the upper right hand corner- a bullish signature. There is upside potential to $1300 according to the inverse head and shoulders breakout (1000-700=300- 1000+300=1300) that was discussed in this report several months ago, as well as every week since.
However, gold has come a long way without an intermediate term correction. It may well keep on carrying on; or it may pull-back from overbought readings.
While 1300 is still a viable target - 1000 may be tested first. Such a move would shake out a lot of the momentum players that have recently hitched a late ride on a fast moving train, as is their want- not ours.

The montly chart shows gold going pretty near parabolic. Without a consolidation/correction, such a move is usually unsustainable. Markets go up. Markets go down. It's a question of when, not if.
If gold does correct, the naysayers and bears will come out screaming, which is just what the doctor ordered. As long as support holds, such a pull-back would offer a sweet entry point, with a better risk to reward ratio than presently is the case.

Silver
Silver didn't have the strong move this week that gold did. It advanced 0.03 cents (+0.20%) to close at $17.42. In contrast gold was up over 2%. Silver has great potential, but for now it's riding on gold's back. That may change, but for now that's the way it is.
The daily chart shows a cup and handle formation, with the rim of the cup marked by the horizontal white line.
Price broke out in late August and moved to the $18 area. Higher lows have formed, but a lower high has also formed.
The chart shows potential to the $20-21 level, if higher lows obtain. A break below the white horizontal line would be bearish.

The weekly chart shows silver has quite a bit of work to do to get back to its 2008 high, while gold is making all-time highs.
Notice the significant resistance (16-18) that silver is trying to break through, which goes back to 2008. It may take a couple of attempts to work off this overhead supply.


Palladium
As was pointed out several weeks ago, palladium led the precious metals group in making a move to new yearly highs. The charts that follow show the steady move higher this year in both dollars and euros (more in the full report).


The above is a short excerpt from the full market wrap report. For a free sample follow the links below or email dvg6@comcast.net
Good Luck. Good Trading. Good Health. And that's a Wrap.

Come Visit Our Website: Honest Money Gold & Silver Report
New Book Now Available - Honest Money


