


The following are some excerpts from a commentary that appeared on our site TreasureChests prior to the plunge this week.
Stock markets remain buoyant while the precious metals sector continues to get hammered. What the heck is going on out there to break the inflationary trend for both groups we have been experiencing off the lows in 2002? Is it that gold is looking much further down the road than most think possible? There is some serious head scratching to do presently if one desires to preserve their wealth moving into next year, so lets get to it.
Simplistically, the assessment concerning both gold and the stock markets above is likely correct if the inflationary trend officials embarked on post the Long Term Capital Management fiasco were to fail, where a collapse in the positive trend for precious metals at this time would be signaling a similar lagged outcome for stocks, and hence the economy, somewhere between six to nine months down the road sequentially. And as you know from our previous discussions, 'The Song Remains The Same' in terms of the key determinant that will affect the ultimate outcome, that being the economy's ability to take all that liquidity the Fed is providing and spawn regenerative growth, which will be directly reflected in monetary aggregate multipliers. (See Figure 1)

As you can see, the 'multiplier effect' is stalling out presently, where a failure at this time would not be a good omen for the global economy into next year, so we will be watching progress across the board in all aggregate measures as the summer approaches to gauge probability factors moving forward. With the health of the US economy central to a successful re-inflation outcome, combined with the stagnant conditions in Europe presently forcing the US Dollar (USD) higher, we could be in for some real fun in 2005 and 2006 (i.e. the lean years of the four year Presidential Cycle) if monetary aggregate growth rates turn negative once again while the currencies force deflation into the equation, as well. (See Figure 2)


Indeed, we could be facing a very rocky road going forward on all fronts sooner than later if a higher degree of self-regenerative capability is not soon felt within the US economy. Official statistics regarding the economy's health have been increasingly supportive of late, but one has to wonder if these representations are more a function of hedonics, adjustments, and non-regenerative fiscal policy measures that seem to go largely un-noticed by most. Solid evidence self sustaining organic growth is emerging in the US economy is not being reflected where it counts, in the money stock, which would then be reflected in the country's 'capital stock', which as you know has been contracting for some time now.
Below is a longer term view of the Amex Gold Bugs Index (HUI) against the S&P 500 (SPX) that I must say would become scary if the larger degree 'head and shoulders pattern' (H&S's) were to form and break to the downside, as the implications would mean a zero premium in precious metals stocks, and would signal an impeding deflationary period. Since Greenspan has officially denied this to be a concern presently, we know it must be his number one concern, as it is certainly being reflected in the charts. (See Figure 3)


Here is a long-term view of gold against the S&P 500 (SPX) now, where the ratio has already signaled it intends to take out the 38% retrace, and is currently residing on head and shoulders support. (See Figure 4)


If head and shoulders support is taken out in the above, a very sudden and dramatic slide should commence in precious metals stocks, especially in the lesser issues where speculators are maintaining an unwarranted firm bid presently, as pointed out last week with our look at Golden Star Resources (GSS) against Newmont (NEM). (See Figure 5)


In my opinion, we are indeed building to such an event sometime in the coming weeks and months, as the breach of long-term support in the Amex Gold Bugs (HUI) / Gold Ratio is unmistakable in significance (i.e. the first time since the run began in 2000), especially when combined with the weight of other significant technical considerations currently characterizing the landscape. (See Figure 6)


As mentioned above, we may be in for a bounce soon in PM's, buy as we are currently descending in either primary wave B, or worse, a fifth wave of primary cycle degree magnitude, unless you are a skilled trader on top of things all the times, one should not consider attempting to catch this knife, as even though conditions are currently oversold, we are only beginning, or at best, half way through the moves in many of the measures defining the trend, where prices can keep dropping in spite of what appears to be supportive stochastic influences. Here is a measure against the banks to show you what I mean. If they were to begin falling harder than they have been, PM stocks will fall both more and faster. (See Figure 7)


From a sentiment perspective, there is very little doubt in my mind we have turned the corner, where in order to facilitate a meaningful bottom, interest in the sector will likely test the channel break in this indicator, which is not commonly followed in itself, but where this web site happens to be the most popular in the world, so its traffic stats are key to monitoring interest in the PM sector. (See Figure 8)

If participation rates are an important factor in painting a healthy picture, then it should not take much interpretative capabilities to put the pieces of the puzzle together in this next chart, where breadth is now falling away from the break and test at the neckline. (See Figure 9)

Source: http://www.sharelynx.com/
Maintaining the same theme, and turning to the internals of the metals themselves, the current Commitment of Traders (COT) Reports do not bode well for future prospects if you are bullish. A few weeks back I noted continued strength in the sector was dependent on small speculators stepping up to the plate. Subsequently, as you may have surmised by gold's performance, they did not. Now however, large speculators have pulled back considerably, but where they could indeed liquidate further sufficiently to break trend-line support indicated below. (i.e. this has likely already transpired as the data is from Tuesday of last week.) (See Figure 10)

Source: http://www.sharelynx.com/
One would have to place a high probability on such an occurrence as the small speculators (i.e. the dumb money) continue to stubbornly hold their positions, possibly meeting margin calls as the prices decline, where one of the top rules experience traders adhere to is never do such a thing. (i.e. I doubt many small specs have sold yet.) (See Figure 11)

Source: http://www.sharelynx.com/
It gets worse when we move into silver, where not only is this kind of thing going on with small traders, even the large speculators continued to hold their positions in spite of mounting losses. (See Figure 12)

Source: http://www.sharelynx.com/
If you were wondering why both the metals and their related equities did not have a more robust bounce after the sell-off last week the above should clear that mystery up, as there still remains a very high degree of complacency in the sector at large. While many traders would have been stopped out with the big drop on Tuesday (i.e. the effective day of the COT report), the fact we did not bounce back suggests we need to see a more thorough cleansing before this can occur. Measuring the gaps in silver provides good instruction as to where this point should be in the short-term. (See Figure 13)

Normally once the measured move is completed, one should look for a bounce to fill the gaps on the upside. Looking at silver, and knowing how greedy the hedge fund managers are, I wouldn't be surprised if we put a double top in silver, like gold, sometime in May. If this were to occur prior to the measure above tracing out, I recommend you sell all of your silver stocks and a portion of your bullion, as we won't be seeing those prices again for a long time.
Bottom line in this regard, the funds have brought such an uneducated / speculative element into the picture anything can happen as we push into the summer. So, if the gaps in silver are not filled right away, and it appears to be basing well, along with a healthy picture on the money supply front being maintained, we may have a buying opportunity develop, not that traders shouldn't try to take advantage of the bounce off of $5.05 anyway. Again though, longer term investors should not be concerned with such movements, as the macro technical picture for the precious metals sector is still not constructive presently, and not likely to get better until a real knuckle wrapping is given to the speculators / traders. Perhaps this is why the Point and Figure (P&F) chart for gold is currently sporting a $296 price objective. (See Figure 14)


And the HUI, you better make sure you are sitting for this one, as the degree (i.e. force) associated with the five box reversal has it heading below 100, because if you have not realized it yet, PM stocks are no longer just correcting, they are crashing. (See Figure 15)


Perhaps you think talk of a move below 100 on the HUI is absurd, because you are fundamentally bullish on gold, and rightfully so in the absence of deflation in the initial stages. But I can assure you anything is possible, as knowledgeable investors are watching for three consecutive closes three percent below 200 (i.e. 194) to signal such a possibility, as per our 'progressive interval system'. In this regard one should note we have now had three consecutive closes below 200, but not in excess of the three percent measure. This is just one more sign of excessive bullishness, not a washed out market, in the absence of a buoyant bounce back over the key metric, which has produced some very significant technical developments from a candlestick analysis point of view.
With the exception of the 'outside down reversal candle' in the monthly Philadelphia Gold and Silver Index (XAU) chart, and once a more thorough correction has transpired, the technicals for precious metals stocks still look constructive long-term, especially considering the 20 MMA has gone through the 40 MMA, triggering a classic 'buy signal', and where we are likely just testing now until proven otherwise. One would have to be a buyer at 75 on this basis, even if the result is a mere options related bounce that we can trade out of later, so we will be watching to see if other key metrics are confirming at the time. (See Figure 16)


The HUI has the identical setup on the monthly chart when compared to the XAU, but the corresponding 'inverse head and shoulders pattern' is slanted, where it would allow for a short-term spike below 180, but not much more. (See Figure 17)


My preferred view would be a move down to the 50 percent retracement mark at 150 for a test of the breakout from the 'inverse head and shoulders pattern' denoted in black. Notice this would meet the 50-point metric in our 'progressive interval system', not to mention see many of the more bearish measured moves currently characterizing the sector traced out. Here is a view of the daily chart that supports this possibility, as the third wave down in this sequence looks to be bound for 171. This should be followed by a forth wave correction higher retracing somewhere between 38 to 50 percent of the previous wave, with the final wave taking us down to the 150 mark. (See Figure 18)

The last hope the bulls have presently lies in the fact the weekly chart has not broken yet, but if it does soon, in spite of oversold conditions on the daily chart, another high volume precipitous drop will ensue. Given we are simply testing the break of long-term trend-line support in the HUI / Gold Ratio, which is leading, as the shares have a tendency to do, a break on the weekly is a high probability event at some point in the not too distant future, so investors should steer clear until conditions are conducive for a meaningful bounce or trend reversal. (See Figure 19)

I will finish up our look at PM's today by stating Goldcorp (GG: NYSE) will become the largest core holding in my conservative accounts once the measured move indicated above is complete. (See Figure 20) Robert McEwen is a class act. GG has no debt and is growing organically. It's a 'no brainer' at the mark. Here is the link to their site for your convenience. http://www.goldcorp.com


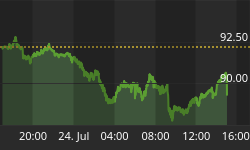
To conclude, with the ECB possibly lowering rates this week (i.e. sending the Euro down further), another FOMC meeting on May 4th possibly yielding some hawkish comments, and market internals still pointing down predominantly, one would be advised to remain cautious at this juncture. Once the Fed meeting is out of the way, a bounce is likely to ensue, and traders may begin to anticipate this if the dollar index spikes up to the 92.50-target this week. This may provide fuel for the forth wave retracement mentioned above, and should be viewed as a trading opportunity only, as depending where we bottom, the 210 - 220 area should not be exceeded, with 200 becoming a likely topping area if we break down hard first.
Because of the number of charts thus far in this commentary, our look at the stock markets will be published separately later in the week.
Above is just a small sample of the analysis provided for Treasure Chests subscribers every week. Fundamental beliefs are key to a success investment strategy, but they must be accompanied by a stringent monitoring of integrated technical analysis that measures key relationships regularly in order to ensure one is one the correct side of the trade when significant adjustments interrupt secular bull markets. I believe we are in such a situation in precious metals presently, and that as we work through the rest of the year, some significant and identifiable buying / trading opportunities will present themselves to informed investors. If you are interested in becoming one of the informed, please visit our site attached below.
Good investing all.


