• 824 days Will The ECB Continue To Hike Rates?
  • 824 days Forbes: Aramco Remains Largest Company In The Middle East
  • 826 days Caltech Scientists Succesfully Beam Back Solar Power From Space
  • 1,225 days Could Crypto Overtake Traditional Investment?
  • 1,230 days Americans Still Quitting Jobs At Record Pace
  • 1,232 days FinTech Startups Tapping VC Money for ‘Immigrant Banking’
  • 1,235 days Is The Dollar Too Strong?
  • 1,236 days Big Tech Disappoints Investors on Earnings Calls
  • 1,236 days Fear And Celebration On Twitter as Musk Takes The Reins
  • 1,238 days China Is Quietly Trying To Distance Itself From Russia
  • 1,238 days Tech and Internet Giants’ Earnings In Focus After Netflix’s Stinker
  • 1,242 days Crypto Investors Won Big In 2021
  • 1,243 days The ‘Metaverse’ Economy Could be Worth $13 Trillion By 2030
  • 1,243 days Food Prices Are Skyrocketing As Putin’s War Persists
  • 1,246 days Pentagon Resignations Illustrate Our ‘Commercial’ Defense Dilemma
  • 1,246 days US Banks Shrug off Nearly $15 Billion In Russian Write-Offs
  • 1,249 days Cannabis Stocks in Holding Pattern Despite Positive Momentum
  • 1,250 days Is Musk A Bastion Of Free Speech Or Will His Absolutist Stance Backfire?
  • 1,250 days Two ETFs That Could Hedge Against Extreme Market Volatility
  • 1,252 days Are NFTs About To Take Over Gaming?
Is The Bull Market On Its Last Legs?

Is The Bull Market On Its Last Legs?

This aging bull market may…

Another Retail Giant Bites The Dust

Another Retail Giant Bites The Dust

Forever 21 filed for Chapter…

  1. Home
  2. Markets
  3. Other

What Can Tell You if Risk Levels Are Increasing?

Imagine this ...

John is hiking up a 5 mile mountain. After each mile hiked, he notices that he is tiring and that he needs more time to rest.

He just finished his third mile, and he is starting the next mile with less energy ... but he still has energy left. The reality is that with each additional mile hiked, his energy is lessening.

Questions ...

1. Will John be able to reach the top and climb all 5 miles?
2. Will his dropping energy lead to fatigue and a retreat before the top?
3. Are the odds increasing or decreasing for him to make it to the top?

Why all these questions and why do they relate to the market now?

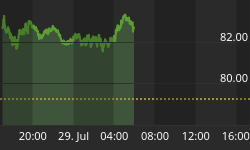
It is because the analogy fits today's chart shown below. The picture of the progress on the trip "up the mountain" is depicted by the SPY's upward price movement on the chart.

The C-RSI (Relative Strength) depicts the decreasing amount of strength as each new mile is climbed. The amount of strength is still positive ... but it is continuing to decrease, so the odds are getting worse for each new mile (each new high) being attempted.

What message is this sending? That each new high is becoming more difficult, and that corresponding risk levels for investors are increasing.

What would it take for an energy (strength) rejuvenation for the upside to occur? The C-RSI would need to break above its black resistance line at label 1 on the chart.

(For an in-depth explanation of the C-RSI, please click on this link: "The C-RSI explained"


Back to homepage

Leave a comment

Leave a comment