


LET'S LOOK AT THE S&P 500 DAILY CHART

This has been a frustrating three weeks with the index trading within the same small range and not much higher than the October highs. If you think this is bad wait until 2010 when I believe well see 6 months of this type of trading. Every cycle that has expired has come in as a high for the past two months but the move down from those points has been limited and created this struggling trend. The struggle is easy to see as each time the market moves to a new high it fails. The last in this group of cycle is now at 270 to 274 calendar days at ¾ of the one year cycle. This is the last of the series and if this doesn't push the index down then an exhaustion upward is likely. The index has been too long in this sideways pattern and the first move out of this pattern could be bogus and set up a false break for a springboard. I still believe this is a distribution before a decline to 960 to 1010. The decline will last either 22, 30 or 45 calendar days. The length and depth of the counter trend down from here will determine the strength of the next and final wave up. The correction could be just 30 days and set up the first week in January as a low.
Because the nature of this advance was a struggle the next trend should be fast.
LET'S LOOK AT THE DOLLAR INDEX

I am still assuming a catalyst is necessary for a decline and the US Dollar could still be that catalyst. Please understand I have very little to indicate a change in trend for the dollar other than everyone on the planet is bearish towards the dollar. The struggling nature of the downtrend can make a rally possible but so far it cannot get out of its own way. Every time this index rallies it gets stepped on which is easily seen. Ever since October I've been looking for a higher low to materialize in this market and there hasn't even been anything close. But for the first time in many months there is a chance for a higher low. The relationship to stocks still seems strong. A further move down in the dollar will be bullish for stocks but a rally could start the move down in stocks.
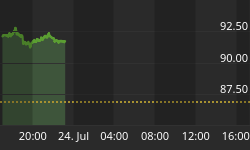
LET'S TAKE A QUICK LOOK AT THE FTSE-100

The FTSE has a dominant 144 calendar day cycle and it has reached that time window. The cycle is divide into 1/8 and 1/3 as we do with everything. In order to determine if there is any validity to the cycle those divisions should show up as a vibration of sorts. There are 9 divisions and 5 have been spot on. So there is some indication for a top from time. Remember this is a probability not a certainty.
So there is timing for high in more than one index from different time cycles.
Disclaimer: All the reports and content in the entire McLaren Report web site (including this report) are for educational purposes only and do not constitute trading advice nor an invitation to buy or sell securities. The views are the personal views of the author. Before acting on any of the ideas expressed, the reader should seek professional advice to determine the suitability in view of his or her personal circumstances.


