


Market Wrap
Week Ending 12/4/09
The Dollar
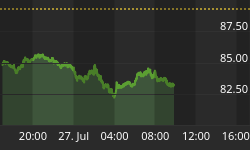
First up is the daily $USD chart. The dollar's relentless fall is clearly evident. Price has broken above its downward sloping trend line, and is presently attempting to clear horizontal resistance marked by the yellow band.
MACD has made a positive crossover and the histograms have moved into positive territory as well. RSI has turned up above 50 (55). The indicators look promising, but the dollar has a habit of disappointing.
If the dollar breaks above upper resistance (76.5), it would have a large impact on the other markets: stocks, bonds, commodities, and gold. Consequently, the dollar warrants close monitoring.

The next chart shows the reason why the dollar rallied this week: short term interest rates spiked up. Both 1 year treasury yields and the dollar have been closely tracking one another.
Notice the large spike up in short term rates in the bottom right hand corner of the chart. Yields remain miniscule, however, the move percentage-wise was large, and the dollar reacted accordingly.
The direction of short term interest rates will play large in the direction of the dollar, and other markets as well. It remains to be seen if short term rates continue to rise, providing support to the dollar; or if rates remain subdued, taking support away from the dollar.

If the dollar rallies, stocks, commodities, and gold, will likely correct to the downside. So far, gold has shown the strongest reaction to the dollar's move higher.
Gold
Gold fell 45.20 to close at 1162.40, for a weekly loss of -3.74%. Going into Friday, gold was up for the week. Friday's action took all the gains away and then some. Gold has gone parabolic in the last few weeks, and a correction/consolidation was mentioned in last week's report, as being constructive for the long term viability of the gold bull.
So far, the pullback has been minimal. GLD is testing its 20 dma, and just below that the 50 dma resides. MACD remains positive, but it is curling over and looks about ready to make a negative crossover. Notice the big expansion in volume on Friday's move down. The various support zones are indicated on the chart.

Silver
Silver positively diverged from gold this week, closing up 0.21 cents to $18.50 for a +1.18% gain; while gold lost almost 4%. The daily chart shows silver holding above short term support at 18. Overhead resistance, as evidenced by silver's upper diagonal trend line, is just above 19.
MACD has made a slight negative crossover, which could easily be reversed, or intensified. RSI and MACD show negative divergences, but these do not have to be resolved by falling prices. Price trumps all indicators, and right now price is hanging tough.

Next up is the monthly chart of SLV. It would be constructive to see expanding money flows, especially in comparison to the 2008 highs. Notice the convergence of the 20 ema and horizontal support around 15.

Gold Stocks
Gold stocks held up well for the week, with the GDX index down a minimal 0.26%. Recall that physical gold was down about 4%. Both gold and the gold stocks were hit hard on Friday, as the GDX lost over 5%, indicating that the index had been up going into Friday.
The daily chart shows Friday's large gap down on expanding volume, which held just above horizontal support marked by the tan colored ban around 49.
The CCI index at the top of chart plunged from overbought down into negative territory. Notice the dotted vertical lines that connect all other similar moves by CCI with the ROC readings at the bottom of the chart. Each of these set-ups was followed by corrections.
MACD (not shown) has made a negative crossover, but RSI is holding just above the 50 level (51). Chaikin Money Flows are quickly retreating towards zero.
The stock market was up for the week, and this may have provided support for the gold stocks. If the dollar rally continues, both the stock market and gold stocks will have a strong headwind to contend with.
The indicators, and the gap down on expanding volume, suggest more downside action is likely, but price is the final arbiter, and as of now, support is holding. If support doesn't hold, the next target would be the lower yellow zone around 45.

Next up is the weekly chart, which evidences just how close the gold stocks came to making a new all-time high. Upper resistance proved to be too much to overcome, this time, and the index retreated. One negative is the declining money flows, indicated by the CMF index at the bottom of the chart. This must change if the rally is to continue.
Overall stock market risk is still a major consideration. So far, the Fed's money creation, coupled with zero-bound interest rates, has fueled a stock and commodity rally.


The above excerpt is a small sampling from the latest full-length market wrap report, available at the Honest Money Gold & Silver Report website. All major markets are covered with the emphasis on the precious metals. Stop by and check out. Free trial subscriptions are available by emailing dvg6@comcast.net.
Good Luck. Good Trading. Good Health. And that's a Wrap.

Come Visit Our Website: Honest Money Gold & Silver Report
New Book Available - Honest Money


