


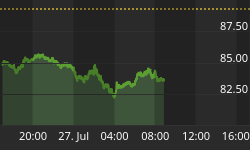


If you recall on last Tuesday, we mentioned that Fedex would be a beneficiary of the "new shopping behavior". (That morning, FDX opened at 85.39 and closed yesterday at 87.52 yesterday ... up $2.13 or 2.49%.)
What is the "new shopping behavior"? It is a growing drift away from in-store shopping and towards on-line shopping. (The Fedex beneficiary expectation had to do with the shipping differential between the two scenarios ... for every "single whole-truck shipment" not going to a retail store, there are perhaps a 100 Fedex trips necessary to deliver that same whole-truck shipment to individual houses.)
What will we discuss today?
Today we will look at one of our short term, intra-day chart models. We refer to it as our Algorithm Model. (The model below is posted every morning on our Standard subscriber section on Section 3, Chart A.)
- This model has two components, an Algorithm trending component and the daily action relative to how much Institutional Investor selling action is going on.
Model Explanation: We look for two events on the Algorithm indicator. First, we look for cross-overs with a reverse trend, and second ... we watch for when it goes above or below the horizontal line.
Then we also look at Institutional selling action. (Be aware that Institutional selling trends in the opposite direction of the stock market.) For this indicator, we look for the trending of the red/blue trend lines. The rose colored bars are the actual daily levels.
- As you can see, this chart goes back to September and tracks the short term trend changes that are especially useful for day-traders. Up until November 19th, the nine trend direction shifts were all in sync.
After November 19th, things changed because the algorithm shifted to a down trend at label 1, but the Institutional Selling trend did NOT change its trend. Instead, the Institutional selling trend continued to trend down which was a positive.
So, what did we have? One positive indicator and one negative which netted out to a "neutral condition". So, during a neutral condition, you would NOT expect an up trend in the market, nor would you expect a down trend.
So, what did happen to the stock market during that time? If you look at the NYA Index chart, you can see that was indeed what the stock market did ... it trended sideways.
What's happening now?
Well, the Algorithm is moving sideways, so its next trend direction has not made itself known yet.
And, the Institutional Selling activity just reached an "Alert" condition yesterday because its red/blue trend lines were almost merged.
*** So now, we have to carefully watch what happens to Institutional Selling action. If it changes to an up-trend (increased selling), then it will pressure the Algorithm to move down and we will have a short-term reversal condition to the downside.


